
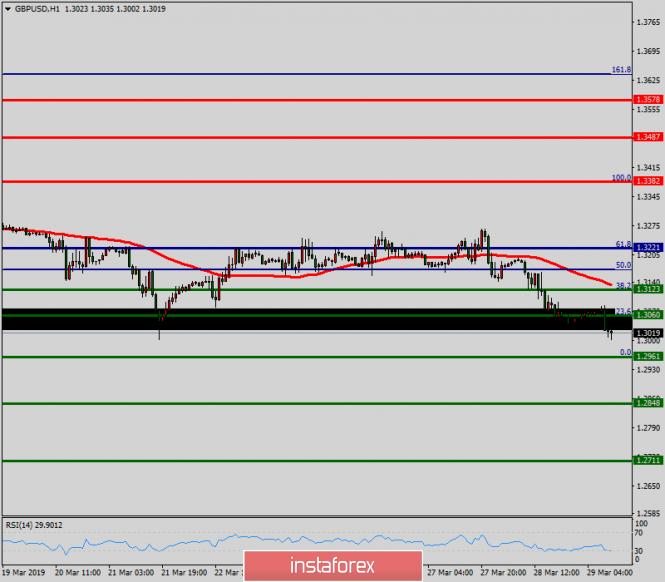
Weekly Pivot: 1.3221.
The GBP/USD broken resistance at 1.3221 which acts as support this this week. The pair is moving between the levels of 1.3221 and 1.3382. As the trend is still above the 100 EMA, a bullish outlook remains the same as long as the 100 EMA is headed to the upside. Consequently, the level of 1.3221 remains a key resistance zone. Therefore, there is a possibility that the GBP/USD pair will move upwards above 1.3221, which coincides with a ratio 61.8% of Fibonacci retracement. The falling structure does not look corrective. In order to indicate a bearish opportunity above 1.3221, buy above this level with the first target at 1.3382. Moreover, if the pair succeeds to pass through 1.3382, it will move upwards continuing the bullish trend development to 1.3487 in order to test the daily resistance 2. On the other hand, if a breakout happens at 1.3123, this scenario may be invalidated.
The material has been provided by InstaForex Company - www.instaforex.com


 Download NOW!
No comments:
Post a Comment