Technical market overview:
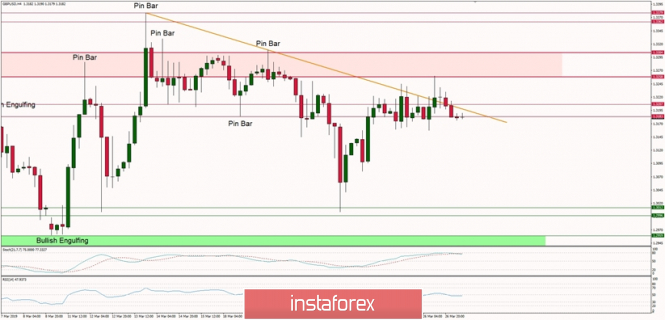
The GBP/USD pair has broken above the orange trendline and tested the technical resistance level at 1.3258 and then suddenly reversed back below the trendline. This market behavior might indicate a false breakout, which is now a major reversal sign for the market participants. This is why the continuation of the down move is anticipated and if the level of 1.3145 is violated, the sell-off might accelerate towards the level of 1.3012 again.
Weekly Pivot Ponts:
WR3 - 1.3650
WR2 - 1.3473
WR1 - 1.3340
Weekly Pivot - 1.3164
WS1 - 1.3039
WS2 - 1.2867
WS3 - 1.2742
Trading recommendations:
The market is now under the technical resistance and under the trendline, so the bias for the daytraders remains bearish and only sell orders should be opened as close as possible to the level of 1.3207 with a protective stop loss just above the level of 1.3258. The target would be the other side of the horizontal trading range, at 1.3012.


 Download NOW!
No comments:
Post a Comment