
Technical outlook:
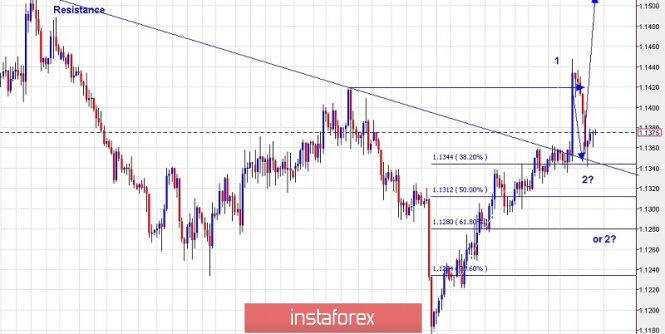
The 4H chart is clearly depicting a story of bulls in control over the next several weeks and months to come. The EUR/USD pair has begun its decline after producing an intraday high at 1.1448 day before yesterday. The major direction can be safely assumed on the north side from here on and question remains from where the next bounce is going to come from. We have presented the fibonacci support ratios here and it begins from 1.1340 levels, extending all the way to 1.1240 levels which are the 0.382 and 0.618 retracement levels respectively. Besides, note that Wave 1 is most likely in place at 1.1448 levels and wave 2 is underway now, expected to terminate around 1.1340 through 1.1240 support zone. The risk remains at 1.1175 levels and till the time prices stay above that support, one can expect higher highs and higher lows to be produced.
Trading plan:
Remain long now and also add more at 1.1240 levels, stop at 1.1175, target is open.
Good luck!
The material has been provided by InstaForex Company - www.instaforex.com


 Download NOW!
No comments:
Post a Comment