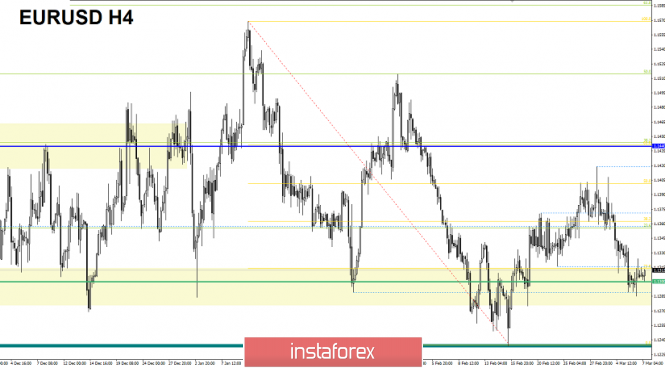
The Euro / Dollar currency pair for the last trading day again showed low volatility of 39 points, as a result continuing an ambiguous fluctuation within the range level. From the point of view of technical analysis, we see that the quotation slowed down several times after reaching the range level of 1.1300 / 1.1320, resulting in a cluster of two-digit doji-type candles. The news was rather calm. Nothing important was published. The only thing that can be singled out is the United States data regarding the change in the number of people employed in the non-agricultural sector from ADP in February, presenting a decrease from 300K to 183K. However, in the market, as you notice, the news is not well-played. When it comes to the information background, a statement of the European Commission was released under the name of the official representative, Margaritis Schinas. According to him, The EU and Britain are still holding heavy discussions around the Brexit agreement. As of now, not a single solution has been found that would comply with the Brexit Agreement, including the protocol for Ireland and Northern Ireland, Schinas said.

Today, in terms of the economic calendar , many traders have been waiting for the important day of the week. Today is the ECB meeting with a subsequent press conference where Mario Draghi might provide us with something interesting about future plans, and, of course, the fate of the interest rate. Before the press conference, the final GDP data (Q4) of Europe will be released, where economic growth is expected to slow down from 1.6% to 1.2%. For the United States, we are waiting for data applications regarding unemployment benefits, which should be reduced.
EU 13:00 MSK - GDP (y / y) (Q4)
EU 16:30 Moscow time - Press conference of the ECB
Further development
Analyzing the current trading chart, we see how the quote stubbornly stands within the range of 1.1300 / 1.1320, as if traders are waiting in anticipation of the ECB meeting. It is likely to assume that the stagnation will still remain in the market; however, closer, at the time of the press conference. Volatility may increase which may allow breaking through the boundaries. Traders, in turn, occupy a waiting position, monitor clear breakdowns of boundaries and pay close attention to the information background.

Based on the available data, it is possible to decompose a number of variations, let's consider them:
- Consider buy positions in case of leveling and fixing higher than 1.1330.
- Consider sale positions after fixing the price lower than 1.1280.
Indicator Analysis
Analyzing a different sector of timeframes (TF ), we see that in the short term there is an upward interest. However, due to the fact that there is a stagnation at present, indicators may change. Intraday and mid-term prospects maintain a downward interest.
Weekly volatility / Measurement of volatility: Month; Quarter; Year
Measurement of volatility reflects the average daily fluctuation , with the calculation for the Month / Quarter / Year.
(March 7, was based on the time of publication of the article)
The current time volatility is 15 points. It is likely to assume that volatility will accelerate at the evening and during the time of the press conference.
Key levels
Zones of resistance: 1.1440; 1.1550; 1.1650 *; 1.1720 **; 1.1850 **; 1.2100
Support areas: 1.1300 **; 1.1214 **; 1.1120; 1.1000
* Periodic level
** Range Level
The material has been provided by InstaForex Company - www.instaforex.com


 Download NOW!
No comments:
Post a Comment