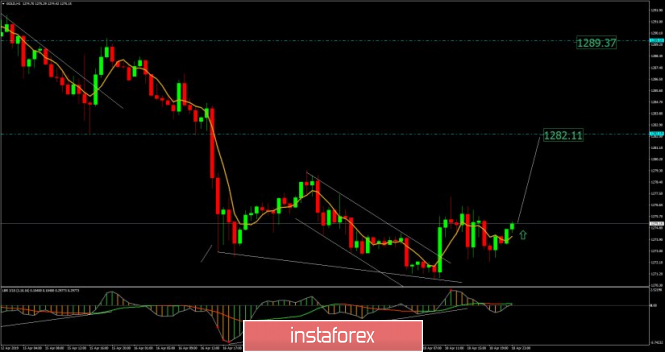
Gold has been trading upwards in past 10 hours. The price tested the level of $1.276.50. We expect potential upward movement in our opinion selling looks extremely risky.

According to the H1 time-frame on the Gold CFD we found that there is the bullish divergence on the 3/10 oscillator, which is sign that sellers losing their power and buyers react. Key resistance levels are seen at the price of $1.282.10 and at $1.289.40. Key support level is seen at the price of $1.270.9.
Situation on the futures market:

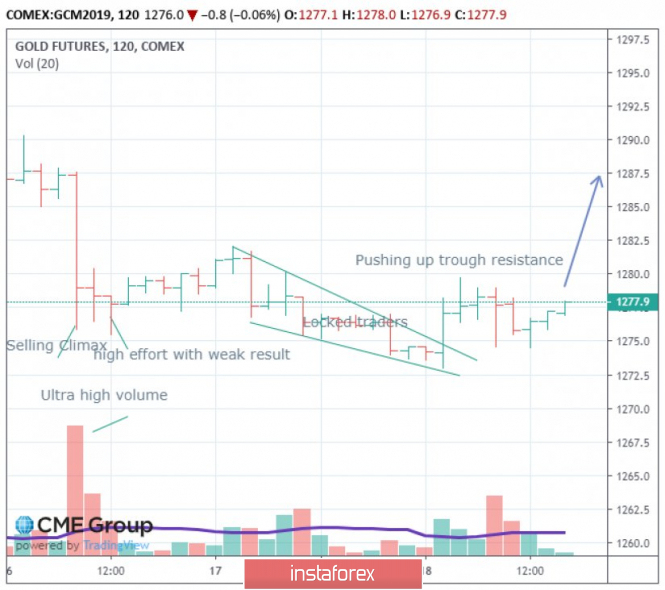
On the futures market we found massive selling climax (excessive volume and range of the bar) in the background, which is strong sign of the strength and big warning for sellers. The climatic bar on the 2H time-frame got 115k contracts traded versus average 20k, which signaled us big difference. The next few bars after the climatic bar were with the narrow range and very high volume but we got high effort with no result, which is another sign of potential strength incoming. Finally, after the decline the downward channel got broken and the buyers did start to buy and accumulate their positions in our opinion. Our advice is to watch for buying opportunities with targets at $1.282.00 and $1.290.00.
The material has been provided by InstaForex Company - www.instaforex.com


 Download NOW!
No comments:
Post a Comment