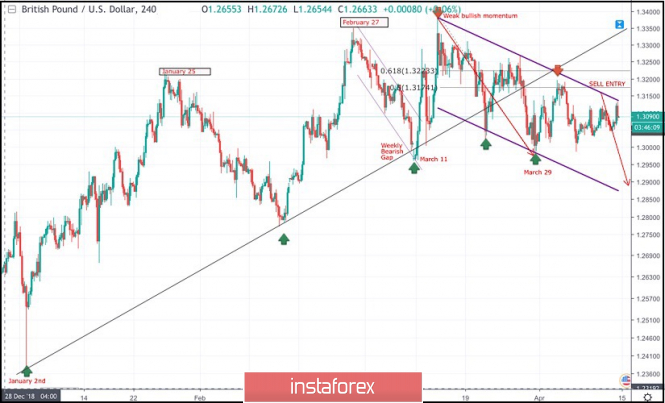
On January 2nd, the market initiated the depicted uptrend line around 1.2380.
This uptrend managed to initiate two successive bullish waves towards 1.3200 (Jan. 25) then 1.3350 (Feb. 27) before the bearish pullback brought the GBPUSD pair towards the uptrend on March 8th.
A weekly bearish gap pushed the pair below the uptrend line (almost reaching 1.2960) before the bullish breakout above short-term bearish channel was achieved on March 11.
Shortly after, the GBPUSD pair demonstrated weak bullish momentum towards 1.3200 then 1.3360 where the GBPUSD failed to achieve a higher high above the previous top achieved on February 27.
Instead, the depicted bearish channel was established.
Significant bearish pressure was demonstrated towards 1.3150 - 1.3120 where the depicted uptrend line failed to provide any bullish support leading to obvious bearish breakdown.
On March 29, the price levels of 1.2980 (the lower limit of the depicted movement channel) demonstrated significant bullish rejection. This brought the GBPUSD pair again towards the price zone of (1.3160-1.3180) where the upper limit of the depicted bearish channel as well as the backside of the depicted uptrend line came to meet the pair.
Currently, the price zone of 1.3140-1.3170 currently corresponds to the upper limit of the depicted bearish channel where another bearish movement may be initiated.
Bearish rejection is still anticipated around the current price levels (1.3140-1.3170).
Further bearish decline is expected towards 1.2920-1.2900 where the lower limit of the depicted channel is located.
Trade Recommendations:
Any bullish pullback towards 1.3150-1.3170 should be considered for another SELL entry. TP levels to be located around 1.3100, 1.3020 then 1.2950 - 1.2920.
S/L to be located above 1.3190.
The material has been provided by InstaForex Company - www.instaforex.com


 Download NOW!
No comments:
Post a Comment