Current dynamic
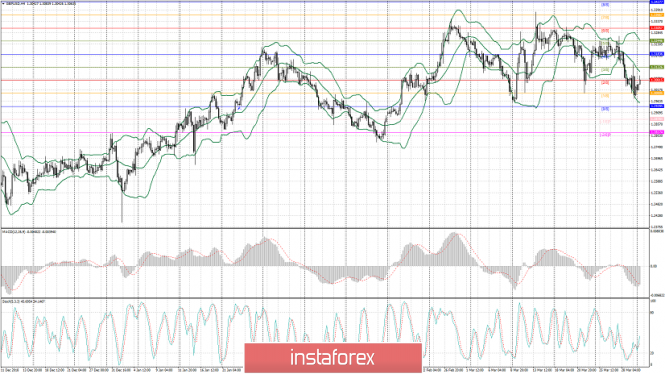
On the 4-hour chart, the instrument is correcting up from the lower line of the Bollinger Bands (1.2976). The main target of the correction is the level of 1.3122 (Murray [3/8]) which corresponds to the middle line of Bollinger Bands. If the bulls manage to raise the rate above the level of 1.3134, the correction can continue to the area of 1.3183 (Murray [4/8]). The area of 1.3183 can prevent the GBP/USD rate from active rising, as the possibility of the reverse of the downward rebound is high there. Meanwhile, the breakout of 1.3183 level will let the price grow to the level of 1.3244 (Murray [5/8]). The downward trend will be restored after the price is set below the level of 1.3000 (Murray [1/8]). In this case, the next targets of sellers will be the level of 1.2939 (Murray [0/8]) which is the key support for the EUR/USD pair in the short term.
Technical indicators mostly reflect the maintenance of the downward potential, but the continuation of upward correction is possible in the short term.
Bollinger Bands are slightly leaned downwards. MACD volumes are decreasing in the negative zone. Stochastic is directed upwards signaling the development of an upward correction.

Support and resistance:
Support levels: 1.3000, 1.2939, 1.2878, 1.2817.
Resistance levels: 1.3061, 1.3122, 1.3183, 1.3244.
Trading scenarios:
Long positions can be opened above the level of 1.3122 with the target at around 1.3183 and stop loss 1.3100.
Short positions can be opened below the level of 1.3000 with the target at around 1.2939 and stop loss 1.3120.
The material has been provided by InstaForex Company - www.instaforex.com


 Download NOW!
No comments:
Post a Comment