Current dynamic
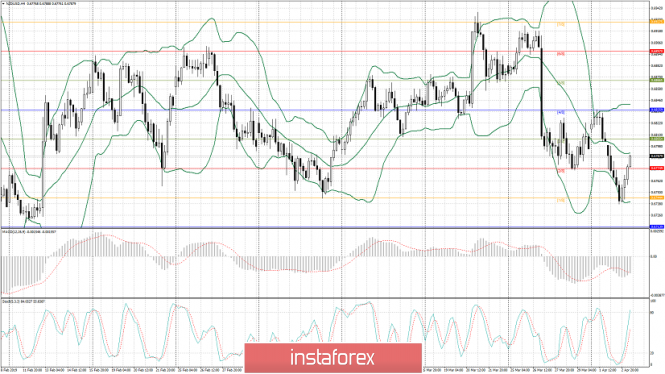
On 4-hour chart, the NZDUSD pair is trading firmly higher heading for the resistance-area of 0.6792-0.6805 (Murray [3/8]). The breakout of 0.6805 can accelerate the pair's climb towards 0.6835 (Murray [4/8]). However, the area of 0.6866 (Murray [5/8]) level could restrict a further rise. Alternatively, a pullback below 0.6774 (Murray [2/8]) could lead the price back to the area of 0.6744 (Murray [1/8]) - 0.6737. A significant decrease is possible after a breakdown of 0.6737, which can develop to the key support level of 0.6713 (Murray [0/8]).
Technical indicators mostly signal the overall uptrend. MACD is actively declining in the negative zone. Stochastics' lines are pointed upwards, ready to reach the overbought area. Bollinger Bands are pointed sideways.

Support and resistance
Support levels: 0.6774, 0.6744, 0.6713, 0.6683.
Resistance levels: 0.6805, 0.6835, 0.6866, 0,6897.
Trading scenarios
Long positions can be opened above the level of 0.6805 with the targets at around 0.6835-0.6866 and stop-loss 0.6785.
Short positions can be opened below the level of 0.6774 with the targets at around 0.6744-0.6713 and stop-loss 0.6794.
The material has been provided by InstaForex Company - www.instaforex.com


 Download NOW!
No comments:
Post a Comment