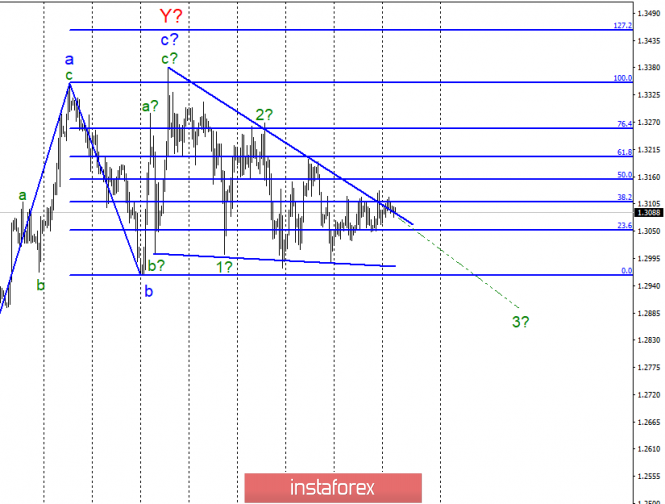
Wave counting analysis:
n April 15, the GBP / USD pair gained about 15 bp. Now, the instrument is trading near the top and forming a tapering triangle line. A successful attempt to break through this line under normal conditions would show the pair's readiness to further increase, but not now. The transfer of Brexit for at least six months became known which made the markets seem to have lost interest in the pair. Based on the current wave marking, the quotes continue to decline. However, I recommend considering this option as the main one if the tool makes a successful attempt to break through the level of 0.0% Fibonacci. Breaking the top of the line of the triangle will give only minimal support to the pound. Thus, with tool purchases, I recommend not to rush.
Purchase goals:
1.3350 - 100.0% Fibonacci
1.3454 - 127.2% Fibonacci
Sales targets:
1.2961 - 0.0% Fibonacci
General conclusions and trading recommendations:
Wave pattern still involves the construction of a downward trend. Markets, as before, cannot withdraw a pair from a triangle, therefore, trading takes place with a minimum amplitude. Accordingly, I recommend expecting the pair to exit the triangle. Unfortunately, even in the event of a breakthrough of the upper line of the triangle, a small amplitude of trades may remain. A stronger signal is needed for the breakthrough of the Fibonacci at 0.0% level.
The material has been provided by InstaForex Company - www.instaforex.com


 Download NOW!
No comments:
Post a Comment