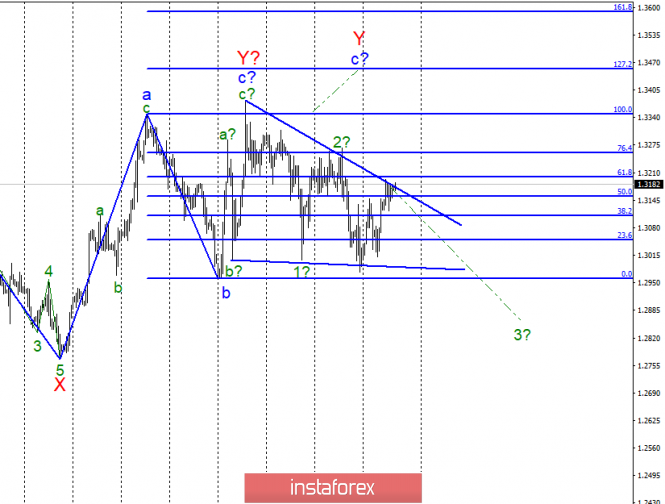
Wave counting analysis:
On April 3, the GBP / USD pair added about 30 bp, but the attempt to break through the top line of the tapering triangle failed. Based on this, the pair retains the chances of building a new downward wave as part of a non-standard descending part of the trend. The whole wave pattern now looks ambiguous and may require adjustments and additions. The news background for the tool is now neutral, since there are no important messages about Brexit promotion. There are plans for new negotiations with the EU to extend the UK release dates. Yesterday, a decision was taken by Parliament. At the same time, before April 12, the UK should decide on the Brexit scenario and discuss it with the EU.
Purchase goals:
1.3350 - 100.0% Fibonacci
1.3454 - 127.2% Fibonacci
Sales targets:
1.2961 - 0.0% Fibonacci
General conclusions and trading recommendations:
Wave pattern involves the construction of a downward trend. However, the tool had serious difficulties in the breakthroughs of 30 figures. The breakthrough of the upper line of the narrowing triangle will indicate that the pair is ready to increase by another 100-150 bp. An unsuccessful attempt at a breakthrough may entail a reduction of the tool back to the area of 30 figure.
The material has been provided by InstaForex Company - www.instaforex.com


 Download NOW!
No comments:
Post a Comment