
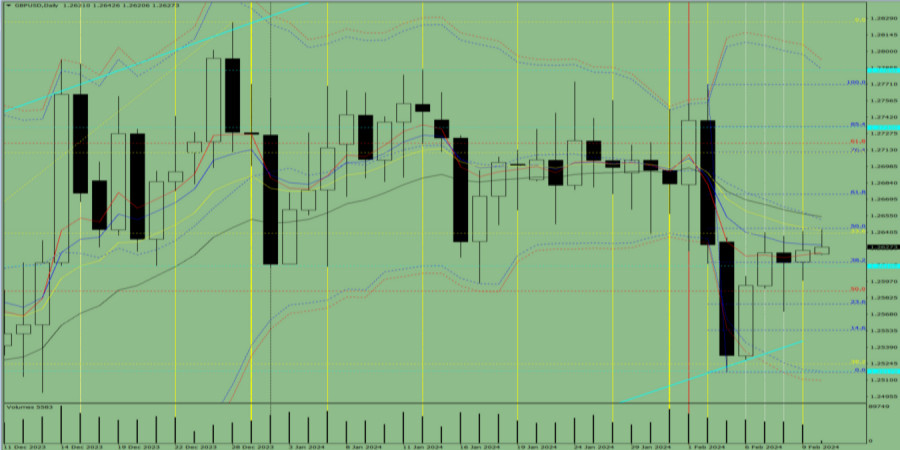
The GBP/USD currency pair may move upward from the level of 1.2624 (closing of Friday's daily candle) to 1.2644, the 50% pullback level (blue dotted line). From this level, a continued upward movement is possible with a target of 1.2674, the 61.8% pullback level (blue dotted line).
Fig. 1 (daily chart).
Comprehensive analysis:
* Indicator analysis – up;
* Fibonacci levels – up;
* Volumes – up;
* Candlestick analysis – up;
* Trend analysis – up;
* Bollinger bands – up;
* Weekly chart – up.
General conclusion: Today, the price may move upward from the level of 1.2624 (closing of Friday's daily candle) to 1.2644, the 50% pullback level (blue dotted line). From this level, a continued upward movement is possible with a target of 1.2674, the 61.8% pullback level (blue dotted line).
Alternatively, the price may move upward from the level of 1.2624 (closing of Friday's daily candle) to 1.2644, the 50% pullback level (blue dotted line). From this level, a downward movement is possible with a target of 1.2628, the 8-period EMA (blue thin line). In the case of testing this level, the price may move up.
Stefan Doll,
Analytical expert of InstaForex
© 2007-2024
Pentru mai multe detalii, va invitam sa vizitati stirea originala.


 Download NOW!
No comments:
Post a Comment