
Analysis of GBP/USD 5M
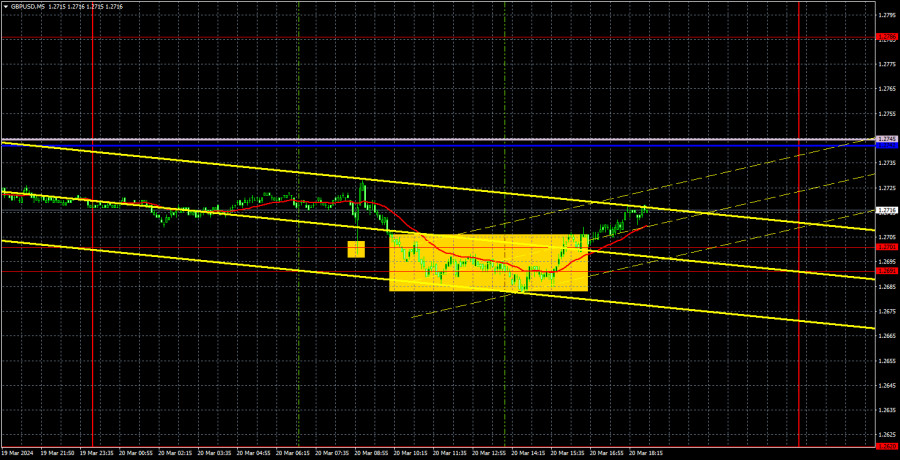
The downtrend persists but again, the GBP/USD pair showed very weak volatility. Despite the release of an important and resonant inflation report in the UK, traders were not active at all on Wednesday. Therefore, we will only reiterate the conclusions we have made earlier: 1) Market movements are practically nonexistent. 2) The market hardly reacts to the fundamental and macroeconomic background. 3) The British pound is declining more as a formality. 4) The price can breach the trend line at any moment, and it may not even need a reason to do so.
We are not considering the results of the FOMC meeting yet, but they are not particularly necessary. Several weeks before March 20, it became clear that there would be no rate cuts. Moreover, it is far from certain at this point that the Federal Reserve will decide to lower rates even by June. Inflation in America is not decreasing, and the Fed remains committed to achieving price stability. The hawkish rhetoric of Fed officials should support the dollar, but the pound is rising much more often. Even a more significant decrease in inflation in the UK could not trigger a decline in the British currency.
Formally, two trading signals were formed on Wednesday. The pair bounced twice from the 1.2691-1.2701 area during the day. The first time was a "jab," and the second time, the price spent about 5 or 6 hours around this area. In both cases, the movement in the intended direction did not exceed 15 pips. And this is not because the signals were bad, but because there was basically no movement.
COT report:
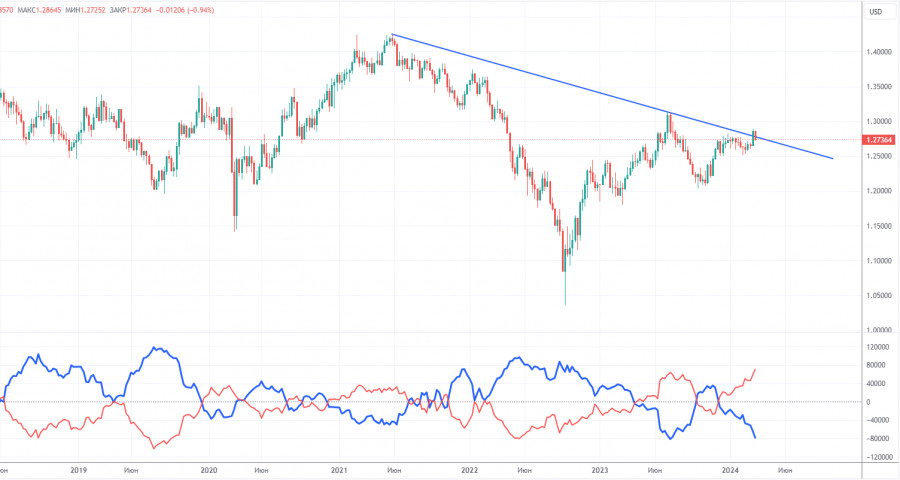
COT reports on the British pound show that the sentiment of commercial traders has frequently changed in recent months. The red and blue lines, which represent the net positions of commercial and non-commercial traders, constantly intersect and, in most cases, remain close to the zero mark. According to the latest report on the British pound, the non-commercial group opened 21,000 buy contracts and 8,900 short ones. As a result, the net position of non-commercial traders increased by 12,100 contracts in a week. Despite the fact that the net position of speculators is growing, the fundamental background still does not provide a basis for long-term purchases of the pound sterling.
The non-commercial group currently has a total of 112,300 buy contracts and 52,800 sell contracts. The bulls have a big advantage. However, in recent months, we have repeatedly encountered the same situation: the net position either increases or decreases, and the bulls or the bears either have the advantage. Since the COT reports do not provide an accurate forecast of the market's behavior at the moment, we have to scrutinize the technical picture and economic reports. The technical analysis suggests that there's a possibility that the pound could show a pronounced downward movement (descending trend line), but there is currently no sell signal on the higher time frames.
Analysis of GBP/USD 1H
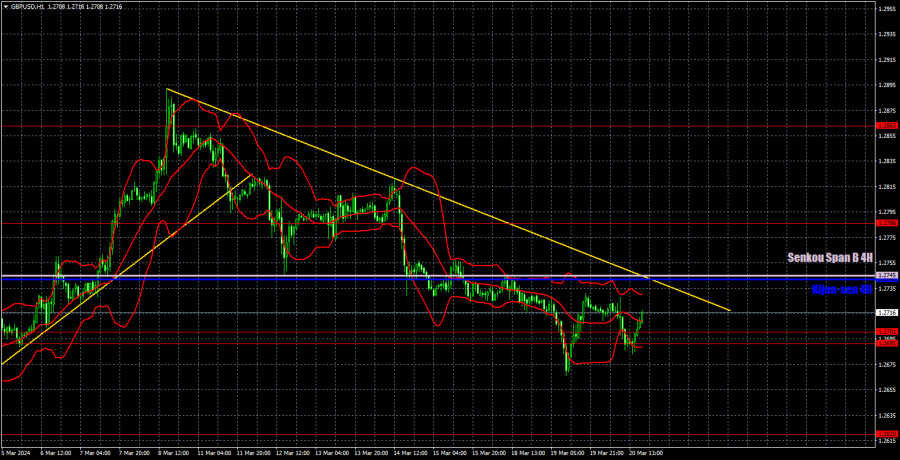
On the 1H chart, GBP/USD is attempting to form a new downtrend. The economic reports and the fundamental background do not support the British pound at all, and yet it continues to decline very reluctantly. We expect the pound to fall, but the market seems unwilling to sell even in the face of a weak UK inflation report. The situation remains the same – the pound simply refuses to depreciate, no matter the fundamentals and macroeconomics.
As of March 21, we highlight the following important levels: 1.2215, 1.2269, 1.2349, 1.2429-1.2445, 1.2516, 1.2605-1.2620, 1.2691, 1.2786, 1.2863, 1.2981-1.2987. The Senkou Span B line (1.2745) and the Kijun-sen line (1.2742) can also serve as sources of signals. Don't forget to set a Stop Loss to breakeven if the price has moved in the intended direction by 20 pips. The Ichimoku indicator lines may move during the day, so this should be taken into account when determining trading signals.
On Thursday, the results of the Bank of England meeting will be announced. The key rate is expected to remain unchanged, and the number of votes in favor of rate cuts will not exceed one. If the Bank turns out to be more dovish, it will be another reason to sell the pound. However, as always, the market may simply refuse to react to this. In addition, UK and US Purchasing Managers Index (PMI) data will be released, which have even less chance of influencing the pair's movement than the BoE meeting.
Description of the chart:
Support and resistance levels are thick red lines near which the trend may end. They do not provide trading signals;
The Kijun-sen and Senkou Span B lines are the lines of the Ichimoku indicator, plotted to the 1H timeframe from the 4H one. They provide trading signals;
Extreme levels are thin red lines from which the price bounced earlier. They provide trading signals;
Yellow lines are trend lines, trend channels, and any other technical patterns;
Indicator 1 on the COT charts is the net position size for each category of traders;
Indicator 2 on the COT charts is the net position size for the Non-commercial group.
The material has been provided by InstaForex Company - www.instaforex.com #


 Download NOW!
No comments:
Post a Comment