
Analyzing Wednesday's trades:
GBP/USD on 1H chart
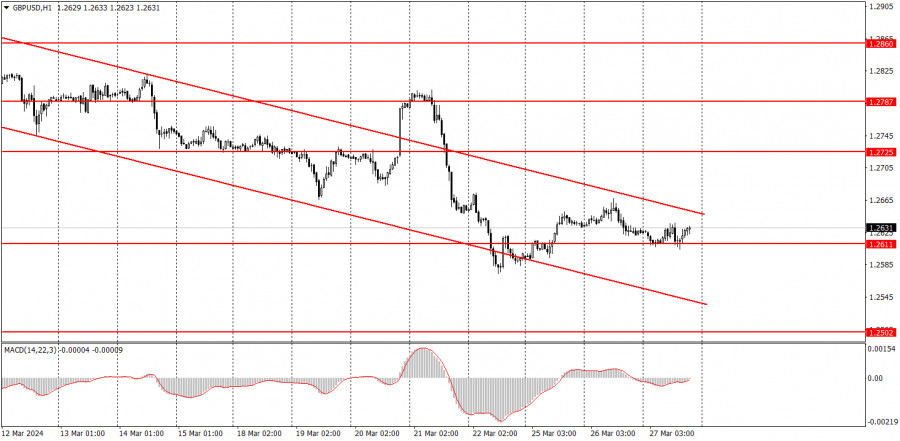
The GBP/USD pair showed absolutely no movement on Wednesday. The price moved along the level of 1.2611 amid low volatility. In general, we have been talking about low volatility practically every day because for two months in a row, the major currency pairs seem to be doing a favor. But, nevertheless, we have to try to work with what we have. For now, the descending channel remains relevant, so in case the price breaks below the level of 1.2611, we can expect the pound to fall further. However, we would like to remind you that the recent movements looks like a decent trend on the hourly chart, while we have a total flat on the 24-hour timeframe, which has been ongoing for 4 months. And it is not yet clear whether this will end anytime soon.
The economic calendar was generally quiet on Wednesday. There were no important or unimportant speeches. Therefore, it is not surprising that the pair barely crawled about 30 pips. The pound continues to trade lazily, illogically, remains overbought, and unreasonably expensive.
GBP/USD on 5M chart
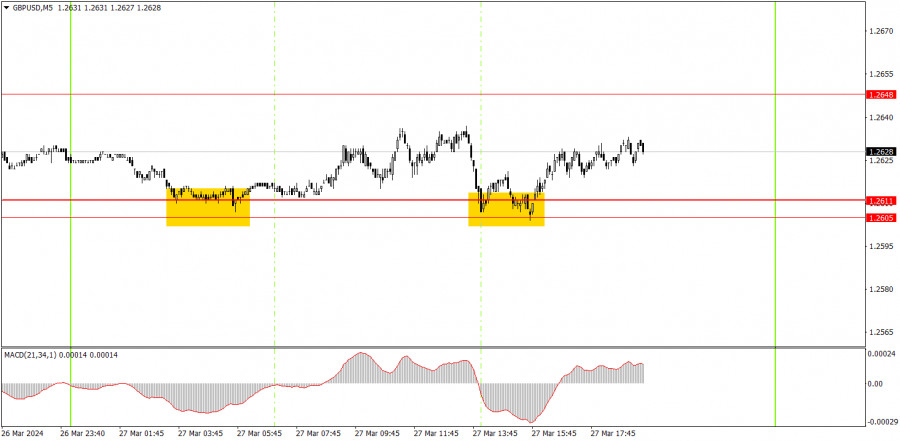
On the 5-minute timeframe, the price bounced from the support area of 1.2605-1.2611 twice, which generated two buy signals. In the first case, the price was up by 15 pips, and even less in the second case. Therefore, novice traders could only open one long position - the second signal simply duplicated the first one. It was impossible to incur a loss on the trade because there were no sell signals. The trade should have been manually closed closer to the evening, so it was even possible to earn about 10 pips profit on it.
Trading tips on Thursday:
On the hourly chart, the downtrend persists. Unfortunately, the market continues to trade sluggishly, which at the very least confuses traders, especially beginners. Nevertheless, the British currency has been gradually declining, which is somewhat encouraging. If the price consolidates above the channel again, it will undermine the prospects of a downward movement.
On Thursday, we expect signals around the area of 1.2605-1.2611. We can only work with rebounds from it or wait for a breakthrough, which may slightly strengthen the current movement and provoke a new decline. But in any case, we are talking about very weak movements. Even when GDP reports will be released in the United States and the United Kingdom.
The key levels on the 5M chart are 1.2372-1.2387, 1.2457, 1.2502, 1.2544, 1.2605-1.2611, 1.2648, 1.2691, 1.2725, 1.2787-1.2791, 1.2848-1.2860, 1.2913, 1.2981-1.2993. On Thursday, final estimates of the Q4 GDP will be released in both Britain and the United States. However, the market may also show a very weak reaction to these events.
Basic trading rules:
1) Signal strength is determined by the time taken for its formation (either a bounce or level breach). A shorter formation time indicates a stronger signal.
2) If two or more trades around a certain level are initiated based on false signals, subsequent signals from that level should be disregarded.
3) In a flat market, any currency pair can produce multiple false signals or none at all. In any case, the flat trend is not the best condition for trading.
4) Trading activities are confined between the onset of the European session and mid-way through the U.S. session, after which all open trades should be manually closed.
5) On the 30-minute timeframe, trades based on MACD signals are only advisable amidst substantial volatility and an established trend, confirmed either by a trendline or trend channel.
6) If two levels lie closely together (ranging from 5 to 15 pips apart), they should be considered as a support or resistance zone.
How to read charts:
Support and Resistance price levels can serve as targets when buying or selling. You can place Take Profit levels near them.
Red lines represent channels or trend lines, depicting the current market trend and indicating the preferable trading direction.
The MACD(14,22,3) indicator, encompassing both the histogram and signal line, acts as an auxiliary tool and can also be used as a signal source.
Significant speeches and reports (always noted in the news calendar) can profoundly influence the price dynamics. Hence, trading during their release calls for heightened caution. It may be reasonable to exit the market to prevent abrupt price reversals against the prevailing trend.
Beginners should always remember that not every trade will yield profit. Establishing a clear strategy coupled with sound money management is the cornerstone of sustained trading success.
The material has been provided by InstaForex Company - www.instaforex.com #


 Download NOW!
No comments:
Post a Comment