
Analysis of EUR/USD 5M
On Wednesday, EUR/USD showed positive trades for the second consecutive day. While the euro's rise from the previous day raised questions, which could be due to the technical correction, the pair continued to correct higher despite the macroeconomic background indicating otherwise. Let's start with the euro area inflation report, which turned out to be weaker than forecasted. Weak inflation means one thing only: the European Central Bank has moved even closer to lowering rates in June, or perhaps even in April. This, naturally, is a bearish factor for the euro, but the market ignored this.
Next, the US ADP report - a NonFarm Payrolls equivalent. Its value in March exceeded the forecast by 40,000, and the February value was revised upward, which should have boosted the dollar. However, the market simply ignored this report as well. Lastly, the ISM Services PMI was released, unexpectedly lower than market expectations but still above the 50.0 mark. And yet, the market immediately sold the dollar after this report. So as we can see, two reports in favor of the dollar were ignored, while the third (not in favor of the dollar) was perfectly executed. The market showed a puzzling reaction.
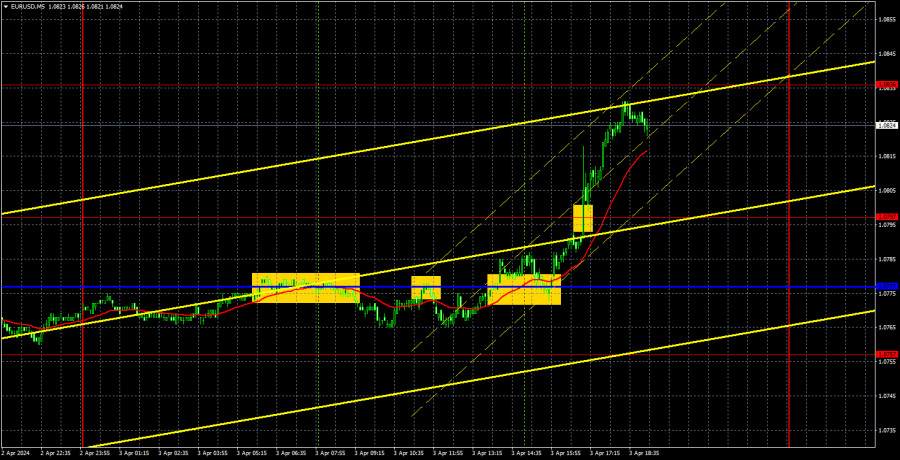
During the European trading session, two sell signals were formed near the critical line, which mirrored each other. In both cases, the price couldn't even fall by 15 pips. Therefore, the short position should have been closed upon consolidation above the Kijun-sen line and long positions should have been opened. The long position turned out to be more successful. The price increased by 50 pips and by the end of the day, it was near the level of 1.0836, where traders could have taken profit.
COT report:
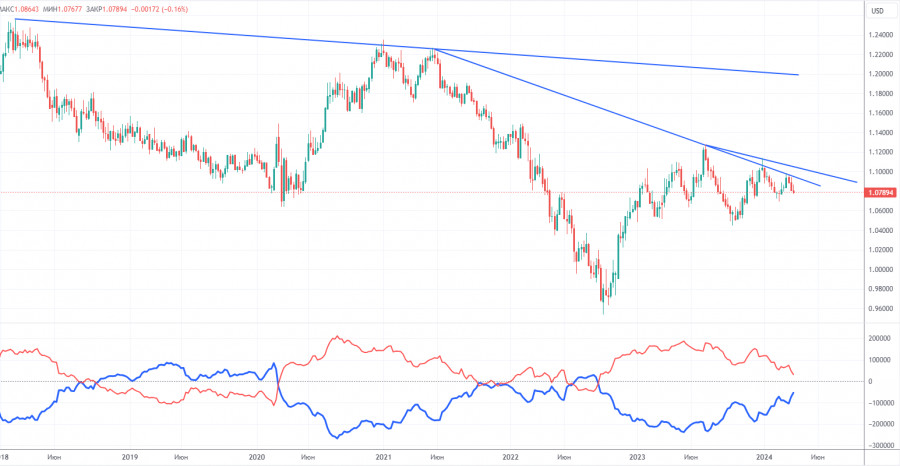
The latest COT report is dated March 26. The net position of non-commercial traders has been bullish for quite some time. Basically, the number of long positions in the market is higher than the number of short positions. However, at the same time, the net position of non-commercial traders (red line) has been decreasing in recent months, while that of commercial traders (blue line) has been increasing. This shows that market sentiment is turning bearish, as speculators increasingly sell the euro. Furthermore, we don't see any fundamental factors that can support the euro's strength, while technical analysis also suggests a downtrend. Three descending trend lines on the weekly chart indicate that there's a good chance of extending the decline.
At present, the red and blue lines are moving towards each other (indicating a trend reversal after a rise). Therefore, we believe that the euro will fall further. During the last reporting week, the number of long positions for the non-commercial group decreased by 2,200, while the number of short positions increased by 15,000. Accordingly, the net position decreased by 17,200. The number of buy contracts is higher than the number of sell contracts among non-commercial traders by only 31,000 (previously 48,000).
Analysis of EUR/USD 1H
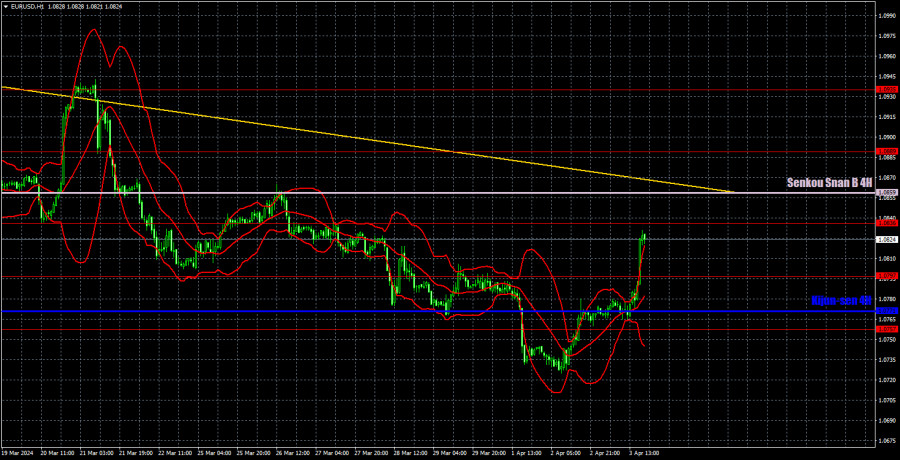
On the 1-hour chart, EUR/USD continues the downtrend, which should pull down the pair. It is currently correcting higher, but the descending trendline continues to support sellers. The dollar should still rise in almost any case, as the overall fundamental background is on its side. The macroeconomic background also supports it, but this week the market has ignored most of the reports instead of responding to them.
On April 4, we highlight the following levels for trading: 1.0530, 1.0581, 1.0658-1.0669, 1.0757, 1.0797, 1.0836, 1.0889, 1.0935, 1.1006, 1.1092, as well as the Senkou Span B line (1.0859) and the Kijun-sen line (1.0771) lines. The Ichimoku indicator lines can move during the day, so this should be taken into account when identifying trading signals. Don't forget to set a Stop Loss to breakeven if the price has moved in the intended direction by 15 pips. This will protect you against potential losses if the signal turns out to be false.
On Thursday, secondary reports in the European Union and the United States may warrant investor attention. In the EU, it will be the final assessment of the Services PMI for March, while in the US, it will be jobless claims. Today, we don't see any reasons for the pair to show high volatility or extend the bullish correction.
Description of the chart:
Support and resistance levels are thick red lines near which the trend may end. They do not provide trading signals;
The Kijun-sen and Senkou Span B lines are the lines of the Ichimoku indicator, plotted to the 1H timeframe from the 4H one. They provide trading signals;
Extreme levels are thin red lines from which the price bounced earlier. They provide trading signals;
Yellow lines are trend lines, trend channels, and any other technical patterns;
Indicator 1 on the COT charts is the net position size for each category of traders;
The material has been provided by InstaForex Company - www.instaforex.com #


 Download NOW!
No comments:
Post a Comment