
Analysis of GBP/USD 5M
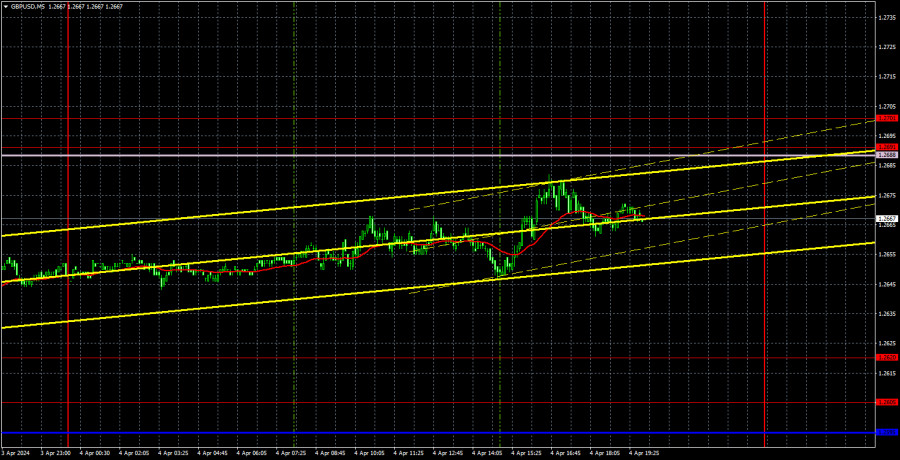
GBP/USD showed moderate growth on Thursday. As we have already mentioned in the EUR/USD article, there are no fundamental or macroeconomic reasons for such movement. However, if this seems strange for the euro, we have become accustomed to it with the pound over the past 4 months. The British pound continues to trade sideways between the levels of 1.2500 and 1.2800 and does not fall even when there are serious reasons for it. Every day we become more convinced that there is an unknown force behind the British currency that prevents it from continuing its downtrend. It is quite possible that the Bank of England is behind this.
Be that as it may, as the pair approached the level of 1.2500, which is the lower boundary of the sideways channel on the daily timeframe, it again moved upward. Macroeconomic and fundamental events were not important, as by all estimates, the dollar was expected to rise practically all week. The Ichimoku indicator lines have no strength in a flat market, so we don't expect a rebound from the Senkou Span B line and a downward movement.
It is a good thing that there were no trading signals yesterday. The pair showed illogical movement, and volatility was low again. On average, the pound moves about 50-60 pips a day, which is quite small. At least not enough for profitable trading. During the day, the price did not even come close to important levels and lines. We expect that over the next few weeks, the pair will move towards the upper boundary of the sideways channel — the level of 1.2800.
COT report:
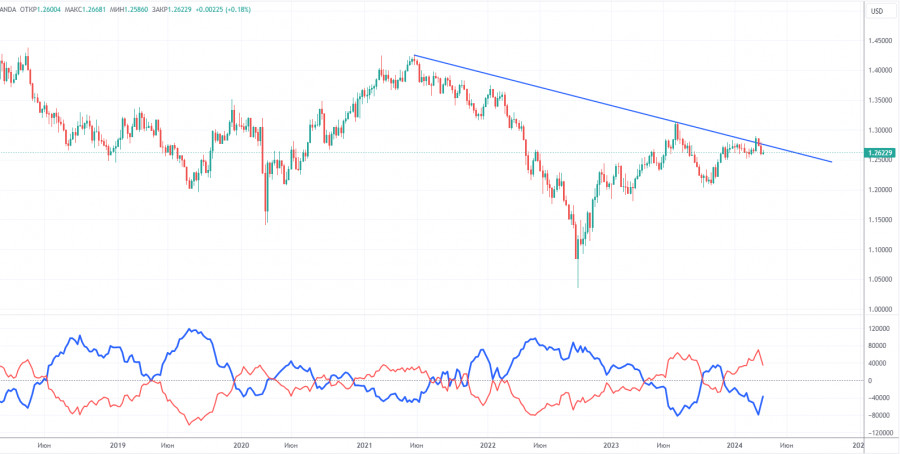
COT reports on the British pound show that the sentiment of commercial traders has frequently changed in recent months. The red and blue lines, which represent the net positions of commercial and non-commercial traders, constantly intersect and, in most cases, remain close to the zero mark. According to the latest report on the British pound, the non-commercial group closed 11,300 buy contracts and opened 6,700 short ones. As a result, the net position of non-commercial traders decreased by 18,000 contracts in a week. It is quite interesting that even such changes do not lead to a significant decline in the pound. The fundamental background still does not provide a basis for long-term purchases of the pound sterling.
The non-commercial group currently has a total of 91,300 buy contracts and 56,100 sell contracts. The bulls no longer have a significant advantage. And yet, the pound refuses to fall, but such irony cannot persist. The technical analysis also suggests that the pound should fall further (descending trend line), but we still have a total flat on the 24-hour timeframe.
Analysis of GBP/USD 1H
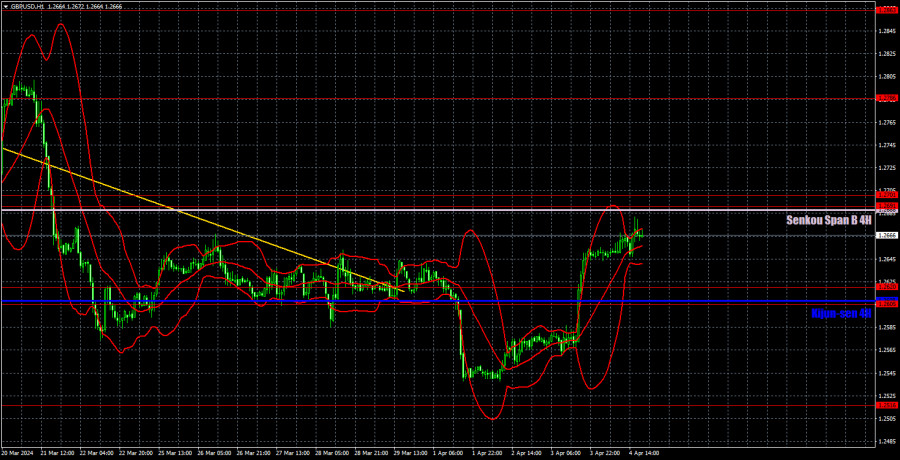
On the 1H chart, GBP/USD has started a new upward movement within the sideways trend on the 24-hour timeframe. We still expect the pound to fall further, however, as long as the sideways trend persists, the pair will either rise or fall, unrelated to news and reports. This week, the fundamentals and macroeconomics have largely favored the dollar, but once again, the pound traded higher.
As of April 5, we highlight the following important levels: 1.2215, 1.2269, 1.2349, 1.2429-1.2445, 1.2516, 1.2605-1.2620, 1.2691-1.2701, 1.2786, 1.2863, 1.2981-1.2987. The Senkou Span B line (1.2688) and the Kijun-sen line (1.2608) can also serve as sources of signals. Don't forget to set a Stop Loss to breakeven if the price has moved in the intended direction by 20 pips. The Ichimoku indicator lines may move during the day, so this should be taken into account when determining trading signals.
On Friday, the UK will release a report on business activity in the construction sector for March. We don't expect this report to influence the pair's movement, which the market currently does not require. Market participants will pay attention to important reports on the labor market and unemployment, but they are unlikely to pull the pair out of the sideways trend. However, the local reaction may be strong.
Description of the chart:
Support and resistance levels are thick red lines near which the trend may end. They do not provide trading signals;
The Kijun-sen and Senkou Span B lines are the lines of the Ichimoku indicator, plotted to the 1H timeframe from the 4H one. They provide trading signals;
Extreme levels are thin red lines from which the price bounced earlier. They provide trading signals;
Yellow lines are trend lines, trend channels, and any other technical patterns;
Indicator 1 on the COT charts is the net position size for each category of traders;
The material has been provided by InstaForex Company - www.instaforex.com #


 Download NOW!
No comments:
Post a Comment