
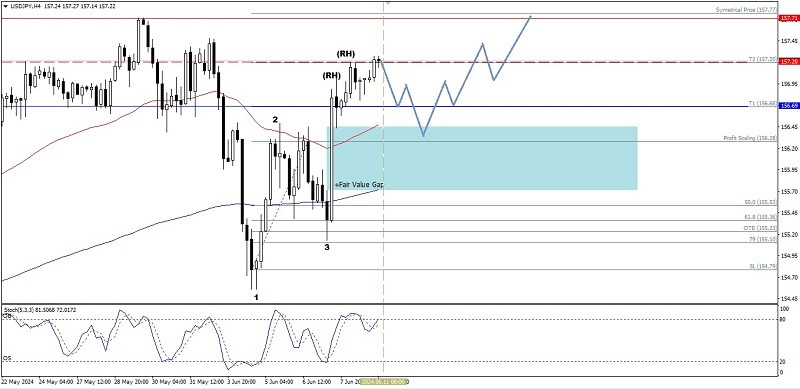
If we look at the 4 hour chart of the main currency pair USD/JPY we can see several interesting things, namely the position of the EMA 50 which is still above the EMA 200 (Golden Cross0) and the emergence of a Bullish 123 pattern which is followed by two Bullish Ross Hooks (RH) so based on the facts- This fact means that it can be predicted that in the near future USD/JPY has the potential to experience strengthening to the level of 157.77, but because yesterday's high at level 157.20 was successfully broken, there is the potential for a downward correction to the level of the Bullish Fair Value Gap area, but during the downward correction If it does not fall below the level of 155.34 then USD/JPY is still in a bullish condition.
(Disclaimer)
The material has been provided by InstaForex Company - www.instaforex.com #


 Download NOW!
No comments:
Post a Comment