On Monday, the GBP/USD pair didn't even attempt to correct in the first half of the day. Only during the American session, when the US report on durable goods orders was published, did some market movements start. However, it's hard to say that the dollar strengthened. The situation is such that we can draw the same conclusions as we did for the EUR/USD pair. The British pound is rising for only one reason – the market is waiting for the first rate cut by the Federal Reserve. Once it happens, the market may start expecting the second rate cut. Formally, the dollar could fall for another couple of months.
Nevertheless, given the complete illogicality of what is happening in the market, we cannot advise anyone to buy the pound or the euro. Even if we assume that everything is logical and the market is just "pricing in" the beginning of the Fed's monetary easing, how can we determine when the dollar selling will end? As we've mentioned, the dollar began to fall two years ago, two months after the first slowdown in inflation. Therefore, in our case, it might start rising in two months. Or maybe tomorrow. Everything will depend on how much the major players have already priced in the Fed's monetary easing, which has yet to begin.
And in November, the US presidential election will take place. A month and a half ago, it was easy to predict who would win, but now it's not. Kamala Harris's ratings are not any lower than Donald Trump's. By the way, Trump has already started using his favorite weapon of psychological pressure called "insults." However, voters can't be fooled twice in a row. Eight years ago, they chose Trump; four years ago, they were ready to choose anyone but Trump. Everyone knew that Joe Biden was 80 years old four years ago. Everyone knew he wasn't the American voter's dream. But Americans were fed up with Trump's daily lies and constant insults. Of course, Trump still has massive support in the US, but does he have more than 50%?
We should also remember that, in essence, all US elections come down to elections in a few key and swing states. Trump does not have 100% support in these states. Therefore, Harris could very well become the next US president. What will be the expectations of major players then?
Let's also note the macroeconomic backdrop, which has no impact on the dollar's movement. When US data are weaker than forecasts, the dollar falls. When they are stronger, practically nothing happens. Yesterday, a report on durable goods orders was published, and the actual value was twice the forecasts. How much did the dollar rise? In principle, by answering this question, you can understand how logical the movements in the currency market are now.

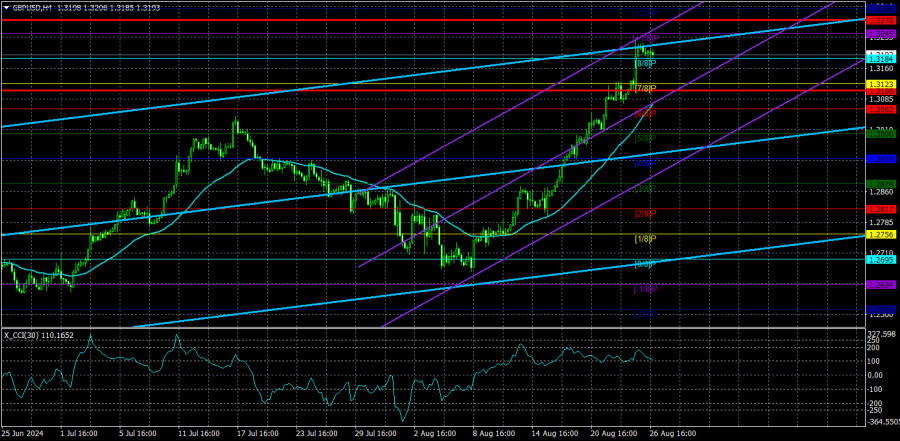
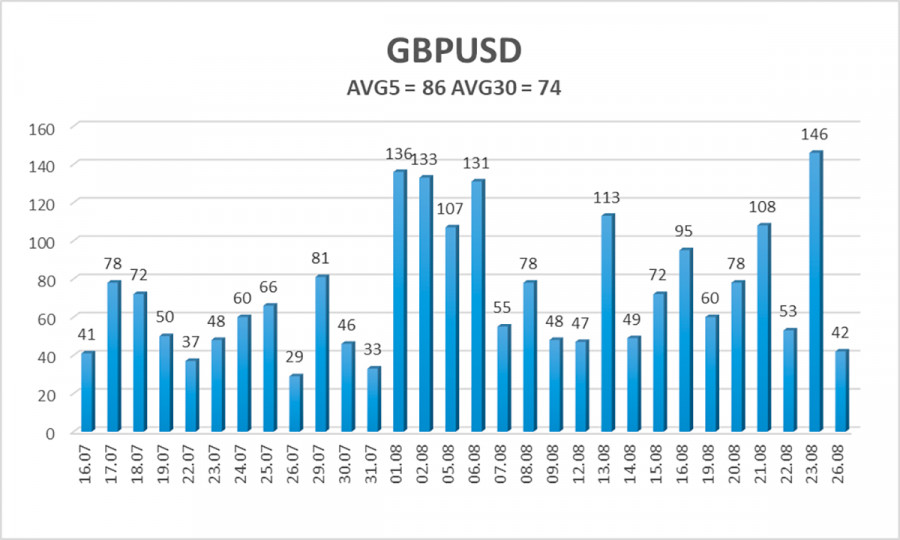
The average volatility of the GBP/USD pair over the past five trading days is 86 pips. For the GBP/USD pair, this value is considered "average." On Tuesday, August 27, we expect movement within the range bounded by levels 1.3106 and 1.3278. The upper channel of the linear regression is directed upwards, signaling the continuation of the upward trend. The CCI indicator may soon enter the overbought zone again and has already formed a triple bearish divergence.
Nearest Support Levels:
- S1 – 1.3184
- S2 – 1.3123
- S3 – 1.3062
Nearest Resistance Levels:
- R1 – 1.3245
- R2 – 1.3306
Trading Recommendations:
The GBP/USD pair continues its illogical rise but retains a good chance of resuming a downward momentum. We are not considering long positions at this time, as we believe that the market has already factored in all the bullish factors for the British currency (which are not much) several times. The market continues to buy without any apparent reason. Short positions could be considered at least after the price settles below the moving average, with targets at 1.2939 and 1.2878. The current movement of the pair has nothing to do with the concepts of "logic" and "regularity."
Explanations for Illustrations:
Regression Channels: help determine the current trend. If both are directed in the same direction, it means the trend is strong at the moment.
Moving Average Line (settings 20,0, smoothed): defines the short-term trend and the direction in which trading should be conducted.
Murray Levels: target levels for movements and corrections.
Volatility Levels (red lines): the probable price channel in which the pair will spend the next 24 hours, based on current volatility indicators.
CCI Indicator: Entering the oversold area (below -250) or the overbought area (above +250) means a trend reversal in the opposite direction is approaching.
The material has been provided by InstaForex Company - www.instaforex.com #


 Download NOW!
No comments:
Post a Comment