Analysis of Friday's Trades
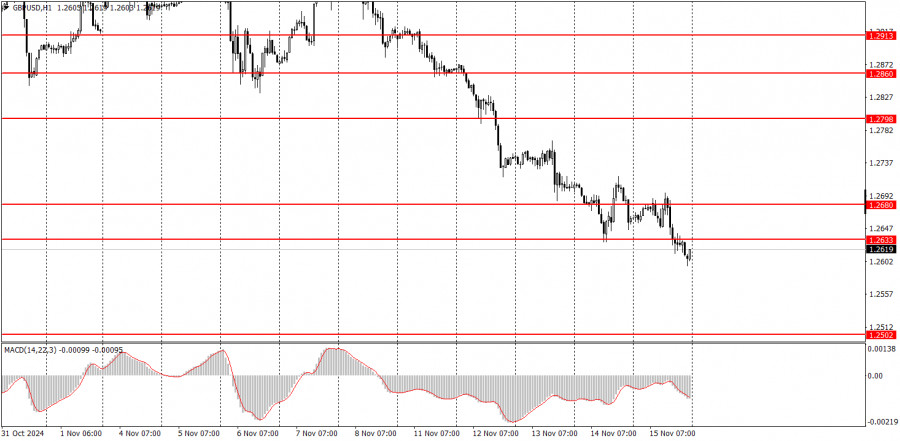
1H Chart of GBP/USD

The GBP/USD pair didn't even attempt to correct on Friday. As noted, two macroeconomic indicators were released from the US, with retail sales being more influential for the market. The UK also published two reports: Q3 GDP grew by 0.1% in the second estimate, down from 0.2% in the initial estimate—a negative factor. Industrial production declined, as usual, and more than traders had expected. Three out of four reports supported the US dollar, which continues to rise effortlessly, even without macroeconomic support. We maintain our view that the USD will appreciate further, as we've been highlighting for two months. Since the beginning of the year, we pointed out the illogical rise of the euro and the pound, predicting the market would rebalance these pairs to fair value. That process is now underway.
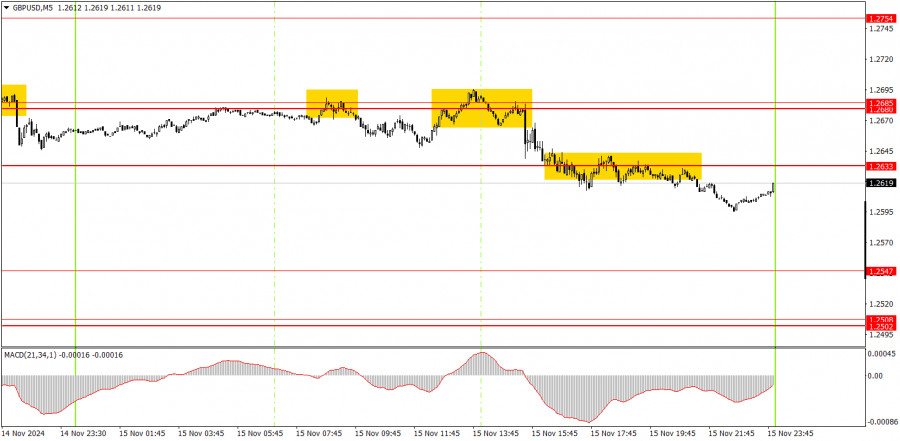
5M Chart of GBP/USD

On the 5-minute chart, two sell signals were formed near the 1.2680-1.2685 area. Novice traders could have executed these trades. Toward the end of the day, the price broke through the 1.2633 level, allowing short trades to remain open. While volatility wasn't the highest on Friday, short positions yielded a profit of 20–30 pips.
Trading Strategy for Monday:
On the hourly timeframe, GBP/USD continues its downward trajectory. We fully support the pound's decline in the medium term, as it seems to be the only logical outcome. The pound may attempt another correction soon, but such a move would require substantial support. Neither Powell on Thursday nor UK macroeconomic data on Friday provided such support. Everything points to further declines for the pound.
On Monday, novice traders can anticipate a continuation of the downtrend since the price has breached another support level at 1.2633.
You can trade using the following levels: 1.2502-1.2508, 1.2547, 1.2633, 1.2680-1.2685, 1.2754, 1.2791-1.2798, 1.2848-1.2860, 1.2913, 1.2980-1.2993. On Monday, there will be no macroeconomic or fundamental background in the UK or the US. However, this doesn't mean the pound cannot continue falling. The market is currently set on buying the dollar, so another decline in the pair could occur even without corresponding news or data.
Core Trading System Rules:
- Signal Strength: The strength of a signal is measured by the time it takes to form (a rebound or level breakthrough). The shorter the time, the stronger the signal.
- False Signals: If two or more trades near a level result in false signals, all subsequent signals from that level should be ignored.
- Flat Markets: Pairs may generate numerous false signals or none during a flat market. Stop trading at the first signs of a flat market.
- Trading Hours: Open trades between the start of the European session and the middle of the US session. Close all trades manually afterward.
- MACD Signals: Trade MACD signals on the hourly timeframe only when there is good volatility and a trend confirmed by trendlines or channels.
- Close Levels: If two levels are close (5–20 points apart), treat them as a support or resistance area.
- Stop Loss: Place a Stop Loss at breakeven after the price moves 20 points in the desired direction.
Key Chart Elements:
Support and Resistance Levels: Target levels for opening or closing positions. Take Profit orders can also be set here.
Red Lines: Channels or trendlines that show the current trend and the preferred trading direction.
MACD Indicator (14,22,3): A histogram and signal line that serve as supplementary trading signals.
Important Events and Reports: Found in the economic calendar, these can strongly influence price movements. During their release, trade cautiously or exit the market to avoid sharp reversals against the preceding trend.
Forex beginners should remember that not every trade will be profitable. Developing a clear strategy and practicing proper money management are critical for long-term success in trading.
The material has been provided by InstaForex Company - www.instaforex.com #


 Download NOW!
No comments:
Post a Comment