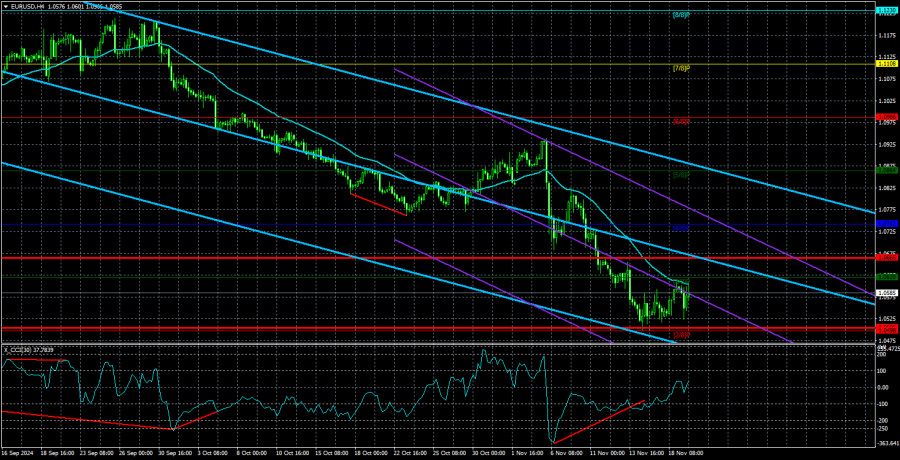
The EUR/USD currency pair continued to trade below the moving average line on Tuesday. While it avoided another drop this time, the price still struggles to stage even a minimal correction. This situation highlights several critical points: The absence of significant buying interest suggests that market participants are not inclined to push the euro higher. The euro remains highly overbought, lacking substantial demand. Our conclusions and forecasts throughout the year's first half appear accurate. We continue to expect a medium-term decline for the euro.
On Monday, European Central Bank President Christine Lagarde delivered a speech, followed by Tuesday's Eurozone inflation report for October. While these events might seem significant at first glance, they ultimately had little impact on the euro. Lagarde refrained from discussing monetary policy, and the inflation report, being the second estimate, rarely deviates from the initial numbers. Thus, neither event influenced market sentiment.
The market continues to be driven by global factors we've repeatedly highlighted. These factors are unlikely to change in the short term. It would also be useful to recall global technical factors. For example, in the weekly timeframe, the pair has been trapped in a horizontal channel for nearly two years. The global downtrend, lasting 16 years, remains intact. Given these conditions, significant downward movements are far more likely. If the pair exits the flat trend, it will likely do so through the lower boundary, and the current price is near this level.
While the fundamental backdrop could change, imagining a scenario where the market starts abandoning the dollar is difficult. Under Donald Trump, U.S. policy is expected to be inflationary, and the Federal Reserve is likely to lower rates less aggressively than anticipated. Furthermore, the pace of rate cuts has already been slower than the market priced in. The euro's two-year rally has merely been a correction, and we anticipate further declines toward the 1.00–1.02 range. With limited news this week, we don't expect sharp movements or reversals. Even crossing above the moving average remains a significant hurdle for the euro.

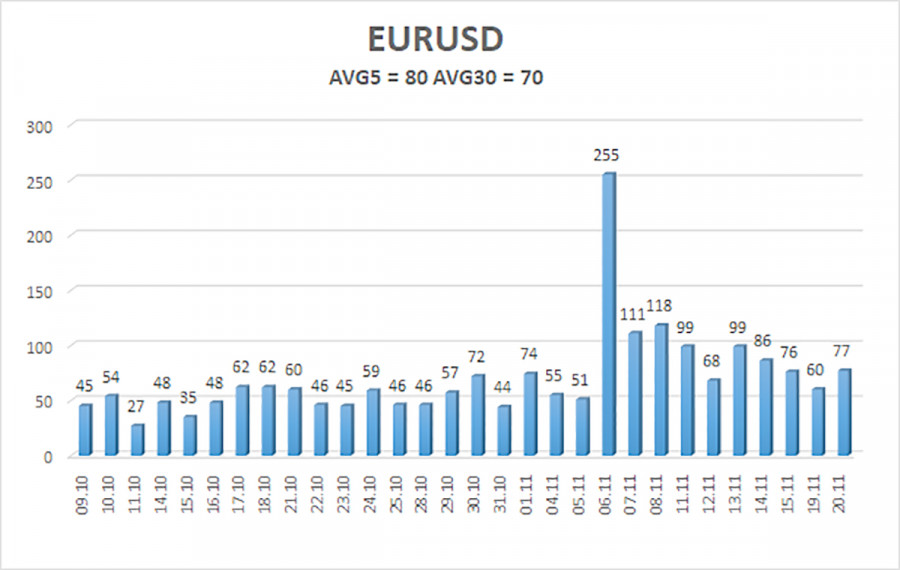
The average volatility of the EUR/USD pair over the last five trading days, as of November 20, is 80 pips, indicating "average" activity. On Wednesday, we expect the pair to trade between 1.0505 and 1.0665. The higher linear regression channel is directed downwards; the global downtrend is still intact. The CCI indicator entered the oversold area, warning about the beginning of a new round of correction, but the round of correction turned out to be weak and has already been completed. A new bullish divergence has been formed at this time, which again warns of a correction, but the price cannot go even above the moving average.
- Support Levels:
- S1: 1.0498
- S2: 1.0376
- S3: 1.0254
- Resistance Levels:
- R1: 1.0620
- R2: 1.0742
- R3: 1.0864
Trading Recommendations:
The EUR/USD pair maintains its downtrend. Over the past months, we have reiterated expectations for the euro to decline in the medium term, fully supporting the bearish trend. While the market may have already factored in most, if not all, future Federal Reserve rate cuts, there is still little reason for the dollar to experience a medium-term decline, although there were few of them before. Short positions remain relevant with a target of 1.0498 if the price remains below the moving average. For those trading based solely on technicals, long positions are possible if the price breaks above the moving average, with targets at 1.0665 and 1.0742. However, we currently do not recommend long positions.
Explanation of Illustrations:
Linear Regression Channels help determine the current trend. If both channels are aligned, it indicates a strong trend.
Moving Average Line (settings: 20,0, smoothed) defines the short-term trend and guides the trading direction.
Murray Levels act as target levels for movements and corrections.
Volatility Levels (red lines) represent the likely price range for the pair over the next 24 hours based on current volatility readings.
CCI Indicator: If it enters the oversold region (below -250) or overbought region (above +250), it signals an impending trend reversal in the opposite direction.
The material has been provided by InstaForex Company - www.instaforex.com #


 Download NOW!
No comments:
Post a Comment