GBP/USD 5-Minute Analysis

The GBP/USD currency pair traded upward on Tuesday, although there was no significant reason for this other than the need to correct after a month-long decline. On the contrary, the ISM services PMI in the U.S. was more positive than expected, which should have strengthened the dollar. However, this did not happen. The market may be betting on Kamala Harris's victory, leading to a U.S. dollar sell-off. The latest exit polls are conflicting, with neither presidential candidate holding a clear advantage. The market may also be preparing for the Federal Reserve meeting. As the dollar weakens, market participants may anticipate a more dovish stance from Powell and the Fed.
That being said, these are only speculations and assumptions. It is challenging to pinpoint why the dollar declined on Tuesday. This week's fundamental background is rich and impactful; the market could react to any event. What exactly it expects from these events remains unclear. We still view this as a correction within a new downtrend. We expect the correction to end within a week or two and for the British currency to resume its decline. However, we must consider the U.S. election results.
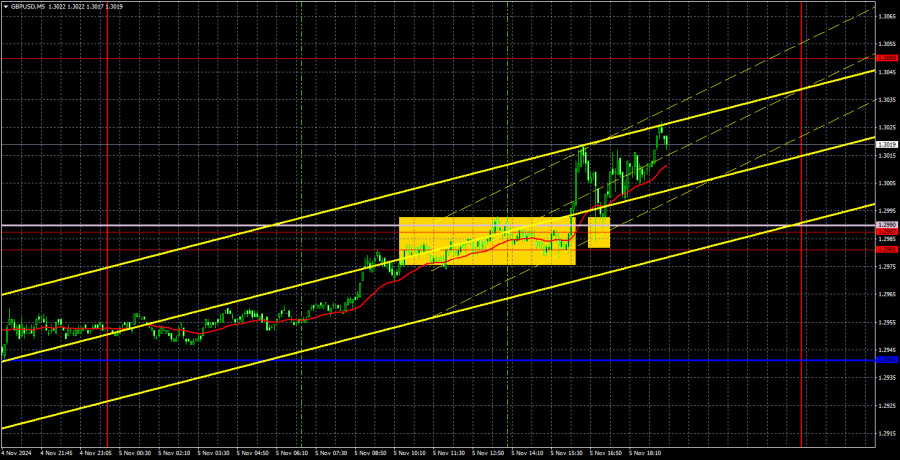
Two trading signals were generated yesterday in the 5-minute timeframe. First, the pair broke through the 1.2981-1.2987 area and the Senkou Span B line and bounced off them from above. Therefore, traders had two opportunities to open long positions. By the end of the day, the price had increased by about 35 pips, which is a decent gain. This upward movement could continue if the market continues to sell off the dollar in anticipation of upcoming events.
COT Report

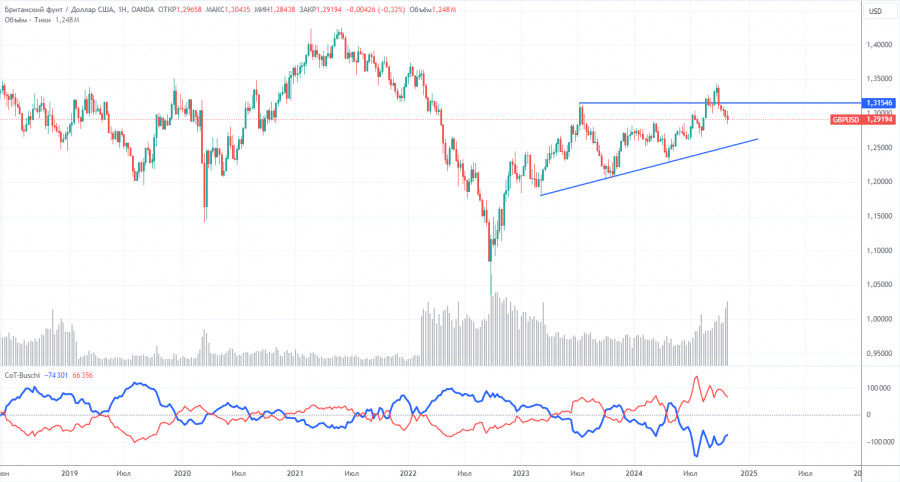
The COT reports for the British pound show that commercial traders' sentiment has constantly shifted in recent years. The red and blue lines representing the net positions of commercial and non-commercial traders intersect frequently and mostly remain near the zero mark. We also see that the latest downward trend coincided with the period when the red line was below zero. The red line is above zero, and the price has breached the key level of 1.3154.
According to the latest report on the British pound, the non-commercial group closed 11,300 BUY contracts and 100 SELL contracts, resulting in a net position reduction of 11,300 contracts for the week. The market is still hesitant to sell the pound in the medium term.
The fundamental backdrop provides no support for long-term buying of the pound, which still has a significant chance of resuming its global downtrend. However, an ascending trend line has formed on the weekly time frame, making a long-term decline unlikely until it is breached. The pound continues to rise despite almost all indicators suggesting otherwise (again, in the medium term), and even when COT reports show big players selling the pound, it still manages to rise.
GBP/USD 1-Hour Analysis

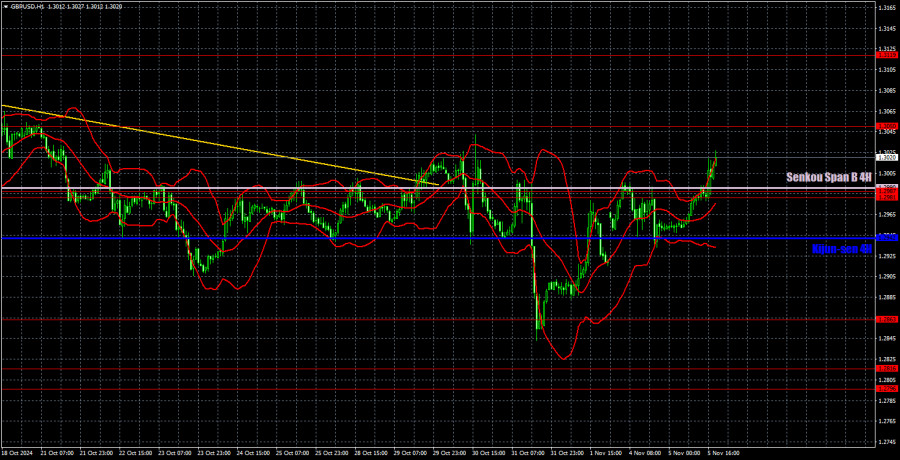
The GBP/USD pair is still in a general downtrend on the hourly time frame. The upward trend has been nullified, so we expect only a strong and prolonged decline in the British currency. Although a correction has begun, it may end quickly, given this week's fundamental background. In any case, there are currently no strong reasons to expect a dollar decline.
For November 6, we highlight the following key levels: 1.2796-1.2816, 1.2863, 1.2981-1.2987, 1.3050, 1.3119, 1.3175, 1.3222, 1.3273, 1.3367, and 1.3439. The Senkou Span B line (1.2990) and the Kijun-sen line (1.2942) may also serve as signal levels. It is recommended to place a Stop Loss at break even if the price moves 20 pips in the intended direction. Remember that Ichimoku lines may shift throughout the day, so consider this when defining trade signals.
No significant reports or events are scheduled in the U.K. on Wednesday, and the U.S. macroeconomic calendar is also empty. However, volatility may remain elevated, and a trending movement could occur as the first U.S. presidential election results may be announced today.
Chart Explanations:
Support and resistance levels: thick red lines around which movement may end. They are not sources of trading signals.
Kijun-sen and Senkou Span B lines: Ichimoku indicator lines transferred from the 4-hour to the 1-hour timeframe. These are strong lines.
Extreme levels: thin red lines where the price previously rebounded. They are sources of trading signals.
Yellow lines: Trend lines, trend channels, and other technical patterns.
Indicator 1 on COT charts: The net position size for each category of traders.
The material has been provided by InstaForex Company - www.instaforex.com #


 Download NOW!
No comments:
Post a Comment