Technical market overview:
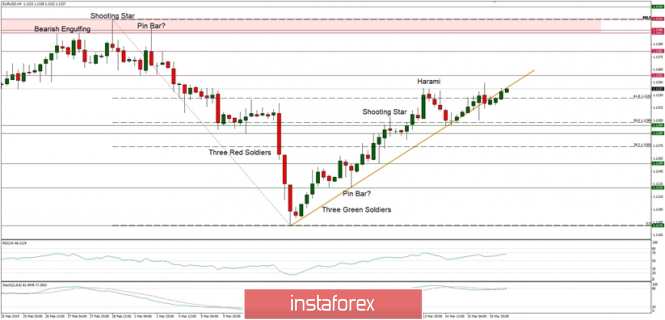
The EUR/USD pair has been moving inside of the horizontal zone just above the 61% Fibonacci retracement at the level of 1.1326, bouncing from 50% Fibonacci retracement at the level of 1.1298 to the local resistance at the level of 1.1344. The market conditions are now overbought and there is a bearish divergence forming in this time frame between the price and the momentum indicator, so the bulls might be losing this battle despite the positive and quite strong RSI. The next technical resistance is seen at the level of 1.1353 and the nearest important support is seen at the level of 1.1294 and then at 1.1284. Please notice, that the recent move up from the level of 1.1176 is considered to be a corrective bounce in a downtrend.
Weekly Pivot Points:
WR3 - 1.1502
WR2 - 1.1422
WR1 - 1.1372
Weekly Pivot - 1.1287
WS1 - 1.1251
WS2 - 1.1168
WS3 - 1.1131
Trading recommendations:
The market is still trading around the level of 61% Fibo, so the battle is still going on and due to the fact that this is a corrective bounce in the downtrend, the bias should be to the downside and only sell orders should be opened. The entry level should be as close as possible to the level of 1.1353 with a tight protective stop loss and the first take profit level is seen at 1.1249.


 Download NOW!
No comments:
Post a Comment