
Technical market overview:
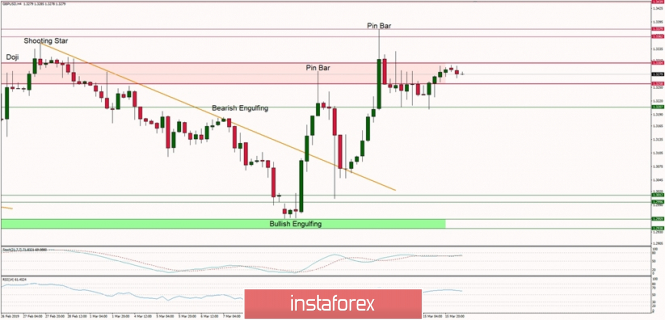
The GBP/USD pair is still moving inside of the narrow zone located between the levels of 1.3207 - 1.3304 as the horizontal correction continues after a wide swing we witnessed last week. There is no important price or candlestick pattern present currently in this market that would indicate a possible breakout in either direction. The longer time frame trend remains bullish, so the bias is still to the upside and the main technical resistance is seen at the levels of 1.3362 and 1.3379.
Weekly Pivot Points:
WR3 - 1.3917
WR2 - 1.3636
WR1 - 1.3473
Weekly Pivot - 1.3224
WS1 - 1.3055
WS2 - 1.2794
WS3 - 1.2638
Trading recommendations:
The market is still consolidation, so it will be better to wait for a trading setup after the consolidation will terminate. The best one would be a breakout in either direction, but due to the fact that the trend is still up, traders should prefer to buy in the local corrections and wait for the market to resume the up move. Only a sustained breakout below the level of 1.2959 would invalidate the short-term bullish bias and deepen the correction.


 Download NOW!
No comments:
Post a Comment