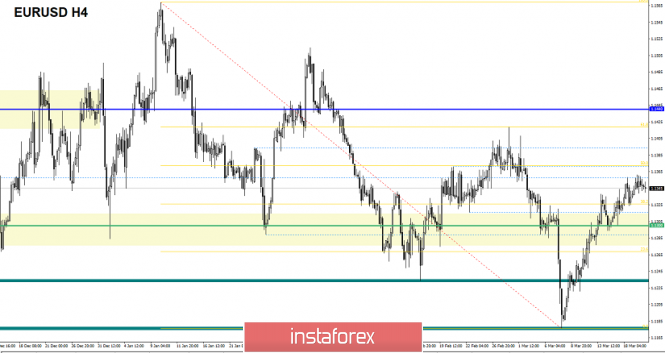
Over the past trading day, the Euro / Dollar currency pair showed an extremely low volatility of 25 points, to put it bluntly, trampling in one place. From the point of view of technical analysis, we see an upward course, where, yesterday, a congestion has formed in the form of waiting positions. Informational and news background is waiting for the upcoming Fed meeting, for the same reason we saw the congestion. In the divorce proceedings of Britain & the European Union, everything is stable in the form of utter confusion. Earlier, the Speaker of the House of Commons, John Bercou, said that Parliament refused to put the Brexit deal to a vote for the third time, citing an agreement in 1604, according to which the question is not "voted on" again and again, if no key changes appear in its wording. Now London is obliged to request a deferment from Brussels until March 21. In turn, the EU is already displeased. The EU coordinator at the Brexit talks, Michel Barnier, warned that any delay in Brekzit's process would involve "political and economic costs" for the EU, and urged London to present a clear plan. France, on the other hand, is ready to use the right of veto to block the meaningless proposal of Great Britain to extend the terms of leaving the European Union.

Today, as I have repeatedly written, the key day of the week is the meeting of the federal commission on open market operations. Experts suggest that the Fed may demonstrate some measures to mitigate monetary policy, and, of course, at least say something about the fate of the rate. In any outcome, the current lull in the trading chart can be replaced by an increase in volatility at a given event.
United States 21:30 MSK - FOMC press conference
Further development
Analyzing the current trading chart, we see that the accumulation of 1.1340 / 1.1360, remains in the market. What to expect next? Probably, there is a continuation of the current bumpiness with a gradual expansion of the amplitude, but it is already in anticipation of the Fed meeting and the first comments / rumors, volatility can increase.

Based on the available data, it is possible to decompose a number of variations, let's consider them:
- We consider buy positions in case of price fixing higher than 1.1365, with the prospect of 1.1380-1.1400-1.1.1420
- We consider selling positions in the case of price fixing lower than 1.1330, with the prospect of 1.1315-1.1300--1.1280.
Indicator Analysis
Analyzing a different sector of timeframes (TF ), we see that in the short term, indicators of indicators have changed to descending against the background of stagnation. Intraday and mid-term prospects both retain an upward interest against the general background of the market.
Weekly volatility / Measurement of volatility: Month; Quarter; Year
Measurement of volatility reflects the average daily fluctuation , with the calculation for the Month / Quarter / Year.
(March 20, was based on the time of publication of the article)
The current time volatility is 16 points.It is likely to assume that due to the upcoming Fed meeting, volatility may accelerate.
Key levels
Zones of resistance: 1.1440; 1.1550; 1.1650 *; 1.1720 **; 1.1850 **; 1.2100
Support areas: 1.1300 **; 1.1214; 1.1120; 1.1000
* Periodic level
** Range Level
The material has been provided by InstaForex Company - www.instaforex.com


 Download NOW!
No comments:
Post a Comment