
Wave counting analysis:
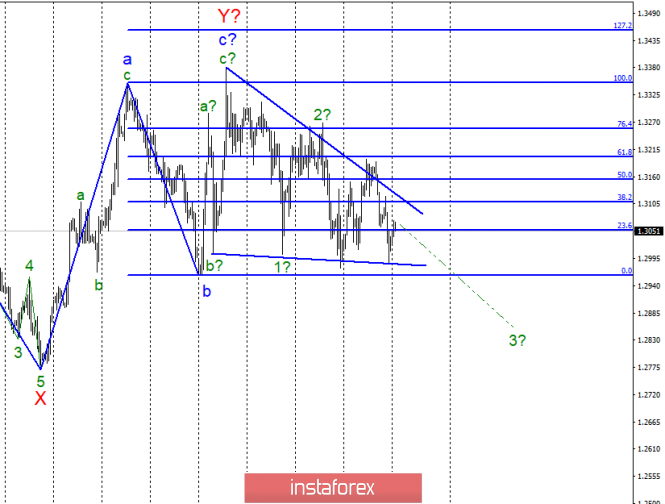
On April 5, the GBP / USD pair lost about 40 bp. However, there was a failed attempt to break through the lower line forming a tapering triangle. Thus, the tool remains clamped in the specified triangle and we just have to wait for it to leave. Based on the current wave counting, we can expect further construction of a downtrend trend, but the overall uncertainty on the Brexit makes the markets cautious. Thus, I recommend waiting for new messages on Brexit and waiting for the triangle to go beyond.
Purchase goals:
1.3350 - 100.0% Fibonacci
1.3454 - 127.2% Fibonacci
Sales targets:
1.2961 - 0.0% Fibonacci
General conclusions and trading recommendations:
Wave pattern involves the construction of a downward trend. However, trades will take place inside it until the pair breaks through one of the lines of the triangle. This also limits the markets of the possibility to open various medium-term and long-term deals. The break through of one of the lines of the triangle will be a strong enough signal to buy or sell.
The material has been provided by InstaForex Company - www.instaforex.com


 Download NOW!
No comments:
Post a Comment