
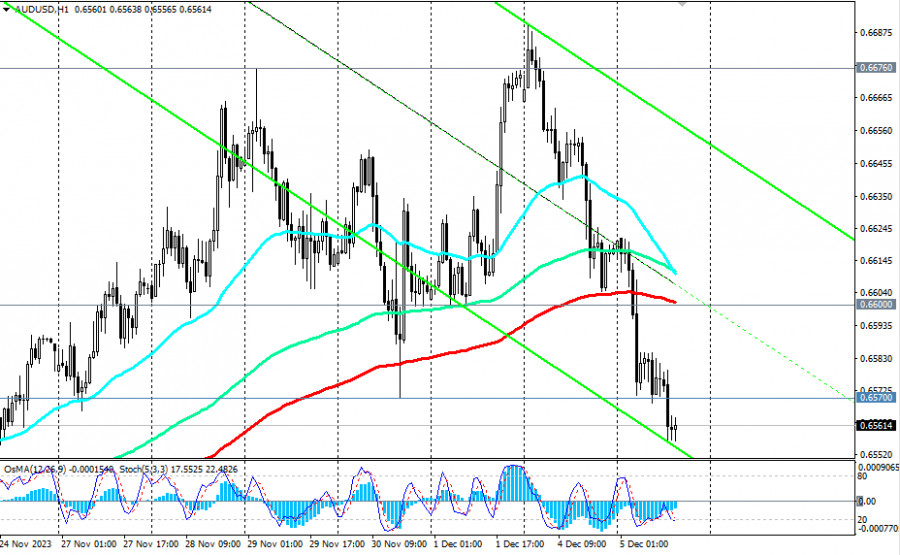
During Tuesday's Asian trading session, the Australian dollar sharply declined, and the AUD/USD pair, breaking the support level of 0.6600 (200 EMA on the 1-hour chart), continued to decline during the first half of the European trading session.
The driver of Tuesday's AUD weakness was the outcome of the RBA meeting, where its leaders decided to leave the interest rate unchanged at 4.35%.
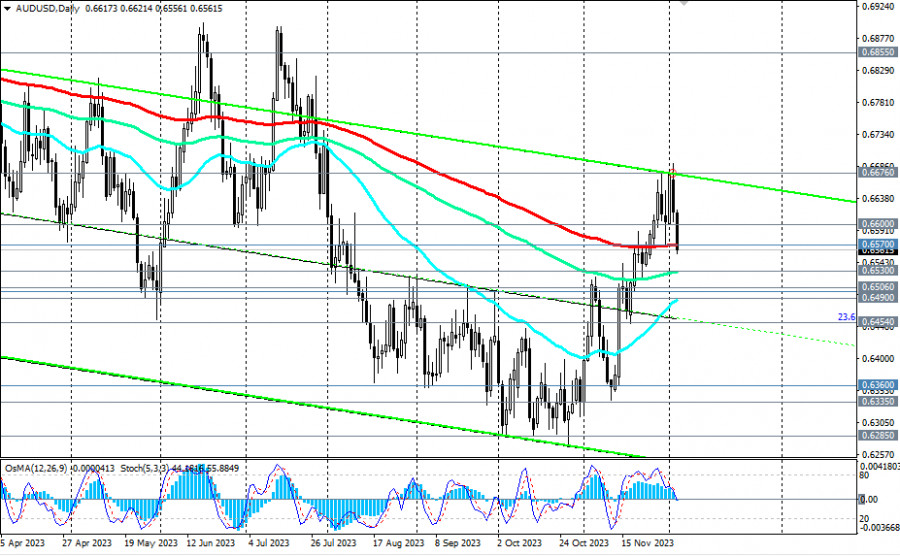
As of writing, AUD/USD was already trading near the level of 0.6560, testing the breakout of the key medium-term support level of 0.6570 (200 EMA on the daily chart).
Further decline of the pair and a breakdown of the important support level of 0.6530 (144 EMA on the daily chart) will signify its return to the zone of the medium-term bearish market.
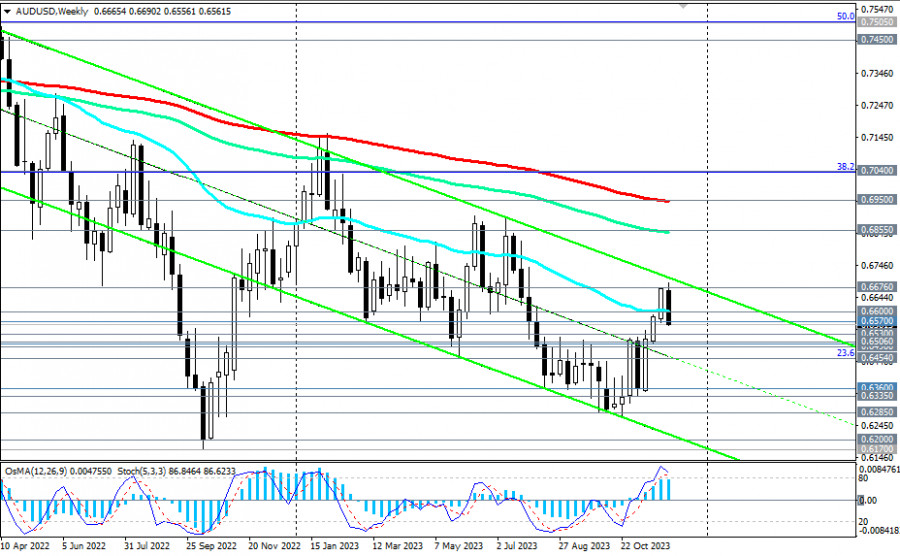
AUD/USD, despite a 3-week correction on Monday, failed to overcome the level of 0.6700 and resumed its decline since the beginning of this week.
Overall, the pair remains in the long-term bearish market zone, and a breakdown of the support level of 0.6530 will confirm the resumption of the long-term downward dynamics of AUD/USD.
In our previous review, we already assumed that the price would break the key medium-term support level of 0.6570 and resume the decline within the framework of the medium-term and long-term bearish trends. The first signal to start implementing this scenario is the breakdown of the 0.6600 support level and the important short-term support level of 0.6587 (200 EMA on the 1-hour chart).
Events, as seen from the AUD/USD dynamics chart, are developing exactly according to this scenario.
A break of today's low of 0.6556 will be the "earliest" signal to resume/increase short positions. The nearest targets for decline after breaking the support level of 0.6530 are the support level zone of 0.6506 (200 EMA on the 4-hour chart), 0.6500, 0.6490 (50 EMA on the daily chart).
In an alternative scenario, the price will break key resistance levels 0.6570 and 0.6600 (50 EMA on the weekly chart), and continue the upward correction, heading towards the important long-term resistance level of 0.6950 (200 EMA on the weekly chart). Its breakout will lead AUD/USD into the zone of the long-term bullish market. Above the resistance level of 0.6600, in this case, long positions will be preferable.
Support levels: 0.6530, 0.6506, 0.6500, 0.6490, 0.6454, 0.6430, 0.6420, 0.6400, 0.6360, 0.6335, 0.6300, 0.6285, 0.6200, 0.6170
Resistance levels: 0.6570, 0.6600, 0.6675, 0.6700, 0.6800, 0.6855, 0.6900, 0.6955, 0.7000, 0.7040
Trading scenarios:
Main scenario: Sell Stop 0.6545. Stop-Loss 0.6585. Targets 0.6530, 0.6506, 0.6500, 0.6490, 0.6454, 0.6430, 0.6420, 0.6400, 0.6360, 0.6335, 0.6300, 0.6285, 0.6200, 0.6170
Alternative scenario: Buy Stop 0.6585. Stop-Loss 0.6545. Targets 0.6600, 0.6675, 0.6700, 0.6800, 0.6855, 0.6900, 0.6955, 0.7000, 0.7040
"Targets" correspond to support/resistance levels. This also does not mean that they will necessarily be reached, but can serve as a guideline when planning and placing your trading positions.


 Download NOW!
No comments:
Post a Comment