
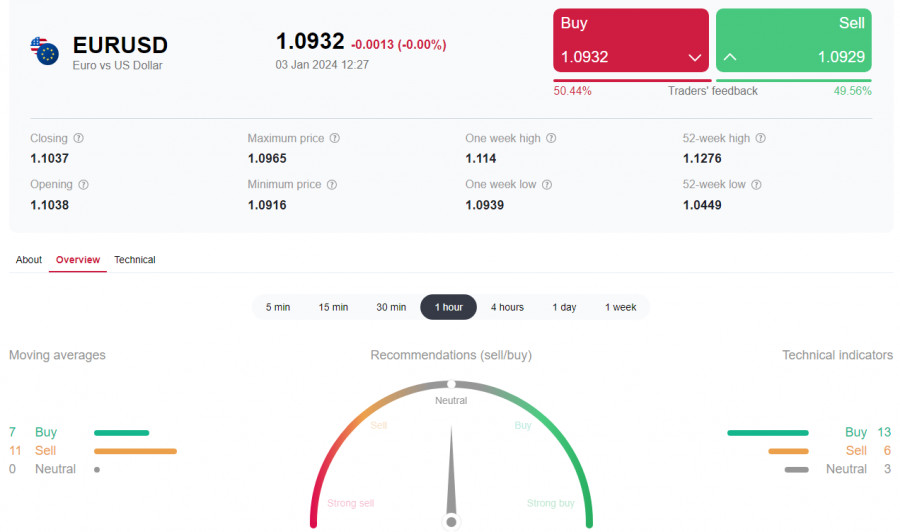
After nearly reaching a local 5-month high of 1.1140 at the end of December, EUR/USD subsequently began to decline. Today, the pair is decreasing for the fourth trading day in a row amid the strengthening dollar, supported by its status as a safe-haven asset.
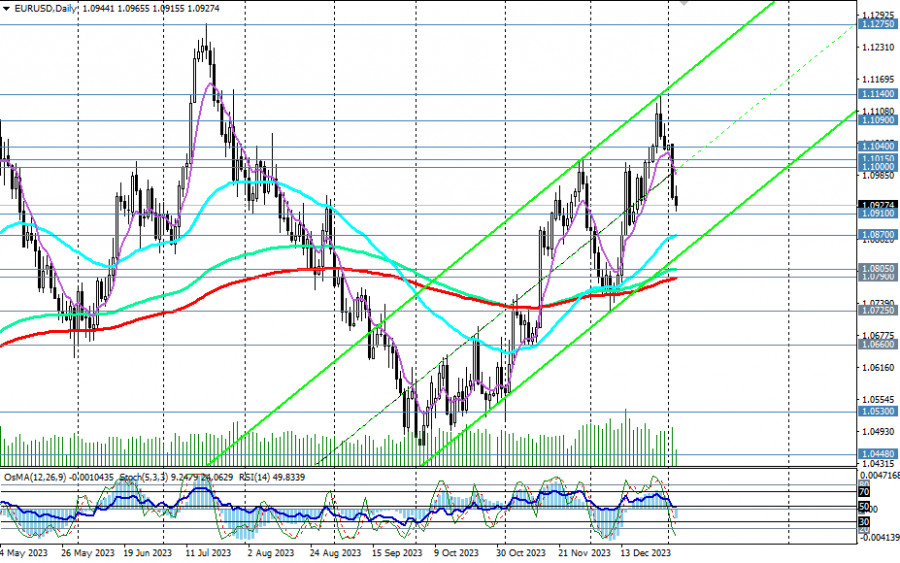
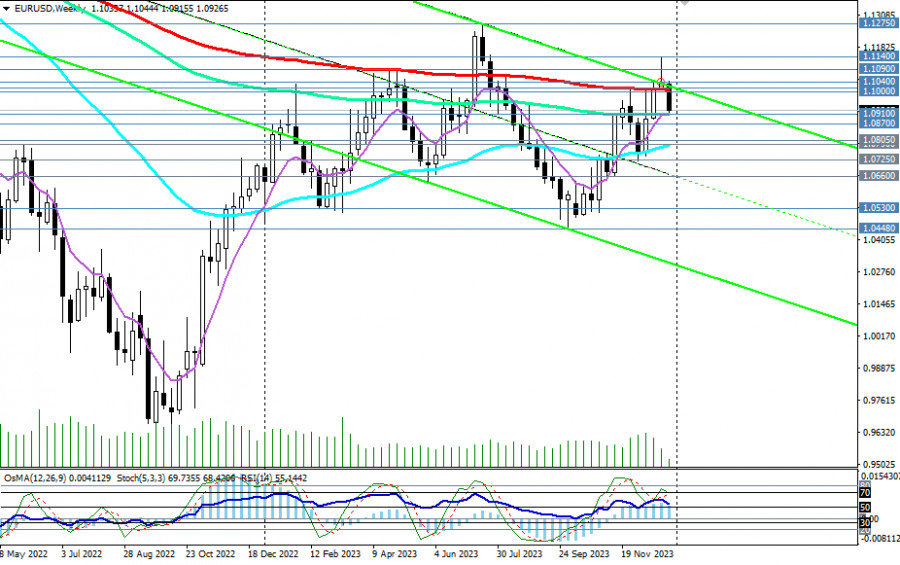
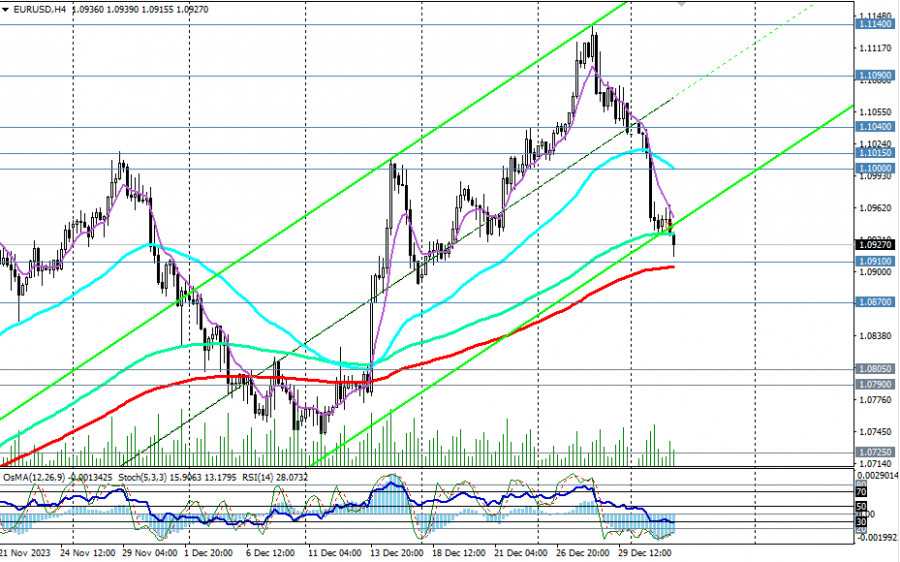
From a technical point of view, EUR/USD is currently experiencing a corrective decline while still remaining within the framework of the medium-term upward trend – above the key support level of 1.0790 (200 EMA on the daily chart, 50 EMA on the weekly chart). The nearest support level, from which a rebound can be expected, is at 1.0910 (200 EMA on the 4-hour chart and 144 EMA on the weekly chart). Breaking through this level will strengthen the downward momentum, directing EUR/USD towards the important support level of 1.0870 (50 EMA on the daily chart).
Further decline and breaking through the key support level of 1.0790 will return EUR/USD to the medium-term bear market and into the long-term downward trend that began in June 2021. Targets for the decline in this scenario are local support levels at 1.0530, 1.0450, and then marks around 1.0400, 1.0300, near which the lower boundary of the downward channel on the weekly chart passes.
In an alternative scenario, after bouncing off the support level of 1.0910 or 1.0870, the growth of EUR/USD will resume towards key resistance levels 1.1000, 1.1015 (200 EMA on the weekly chart).
Breaking through these levels will revive the upward trend and move EUR/USD into the long-term bull market zone.
Here, a signal for implementing this scenario could also be breaking through today's high of 1.0965 and the short-term resistance level of 1.0983 (200 EMA on the 15-minute chart).
Support levels: 1.0910, 1.0900, 1.0870, 1.0805, 1.0800, 1.0790, 1.0725, 1.0700, 1.0660, 1.0600, 1.0530, 1.0500, 1.0450, 1.0400, 1.0300
Resistance levels: 1.0965, 1.0983, 1.1000, 1.1015, 1.1040, 1.1090, 1.1100, 1.1140, 1.1200, 1.1275, 1.1300, 1.1400, 1.1500, 1.1530
Trading Scenarios
Alternative scenario: Buy Stop 1.0970. Stop-Loss 1.0890. Targets 1.0983, 1.1000, 1.1015, 1.1040, 1.1090, 1.1100, 1.1140, 1.1200, 1.1275, 1.1300, 1.1400, 1.1500, 1.1530
Main scenario: Sell Stop 1.0890. Stop-Loss 1.0970. Targets 1.0870, 1.0805, 1.0800, 1.0790, 1.0725, 1.0700, 1.0660, 1.0600, 1.0530, 1.0500, 1.0450, 1.0400, 1.0300
"Targets" correspond to support/resistance levels. This does not mean they will necessarily be reached, but they can serve as a reference point when planning and placing your trading positions.


 Download NOW!
No comments:
Post a Comment