EUR/USD traded marginally higher for most of Wednesday. As usual, we will not analyze the FOMC meeting results immediately after it takes place, as we believe it will take at least a day for the market to "digest" all the information. Therefore, the analysis of the U.S. central bank's meeting will be done tomorrow. For now, let's focus on another equally important and interesting event: the Eurozone inflation report.
Yesterday, we learned that the Consumer Price Index accelerated from 2.5% year-on-year to 2.6%, while the market expected it to decrease to 2.4%. What do these figures mean? The chances of seeing a second European Central Bank rate cut in September have slightly decreased. ECB representatives have repeatedly stated that everything will depend on incoming macroeconomic information. However, the market doesn't care what ECB or Federal Reserve officials say. The market decides on its own when the ECB should cut rates and how often the Fed will cut rates in 2024. Unfortunately, central bank officials have been right so far.
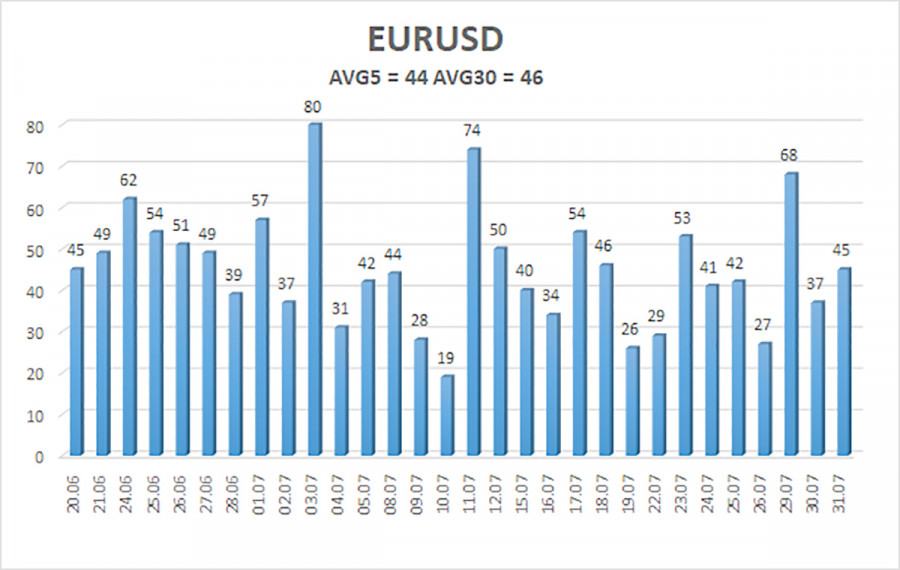
After the release of the report above, the euro, of course, rose by a couple of dozen pips, but to say that this indicator caused volatility would be an overstatement. We have often said that the main problem now is low volatility, which tends to decrease further. The illustration below clearly shows what we mean. The pair moves 40-45 pips per day. On the best days, 60-80 pips. And there have been only four super-successful days in the last month and a half. What is there to talk about?
The fact that inflation is rising in the Eurozone, in itself, doesn't mean much for the euro. Not anymore. The ECB has begun easing monetary policy, while the Fed won't start for at least a few months (we don't believe in a rate cut in September). The EUR/USD pair has been within a narrow range of 1.06-1.10 for seven months, trading purely on technicals. For several weeks, the euro rose for any reason, and now the dollar can similarly rise.
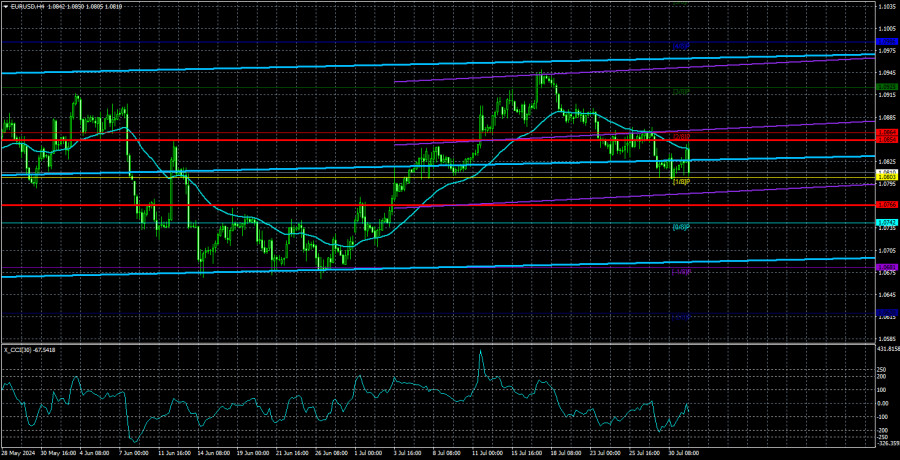
Yesterday, the ADP report on private sector employment (similar to NonFarm Payrolls) also exerted pressure on the dollar. Frankly, this indicator has always been less significant than the classic NonFarms, but another disappointing report from the U.S. triggered a new drop in the dollar. However, when the market received strong reports from the U.S., it also didn't rush to buy the dollar. Therefore, we consider the flat on the daily timeframe as the main trend. Trading should be based on this. We believe that the euro still has the potential to fall. There are currently no reversal signals on the 4-hour timeframe.

The average volatility of the EUR/USD pair over the past five trading days as of August 1st is 44 pips, which is considered low. We expect the pair to move between the levels of 1.0766 and 1.0854 on Thursday. The higher linear regression channel is directed upwards, but the global downward trend persists. The CCI indicator entered the overbought area, a warning of a trend direction change.
Nearest Support Levels:
- S1 – 1.0803
- S2 – 1.0742
- S3 – 1.0681
Nearest Resistance Levels:
- R1 – 1.0864
- R2 – 1.0925
- R3 – 1.0986
Trading Recommendations:
The EUR/USD pair maintains a global downward trend; a downward movement continues in the 4-hour time frame. In previous reviews, we mentioned that we are only expecting the continuation of the global downward trend. We do not believe the euro can start a new global trend amid the ECB's monetary policy easing, so the pair will likely fluctuate between 1.0600 and 1.1000 for some time. Since the price has reversed in the upper part of this range, short positions with targets around the Murray level "-1/8" - 1.0681 remaid valid.
Explanations for Illustrations:
Linear Regression Channels – help determine the current trend. If both are directed in the same direction, it means the trend is strong.
Moving Average Line (settings 20,0, smoothed) – determines the short-term trend and the direction in which trading should be conducted.
Murray Levels – target levels for movements and corrections.
Volatility Levels (red lines) – the probable price channel in which the pair will spend the next 24 hours, based on current volatility indicators.
CCI Indicator: Entering the oversold area (below 250) or the overbought area (above +250) means a trend reversal is approaching.
The material has been provided by InstaForex Company - www.instaforex.com #


 Download NOW!
No comments:
Post a Comment