Analysis of EUR/USD 5M

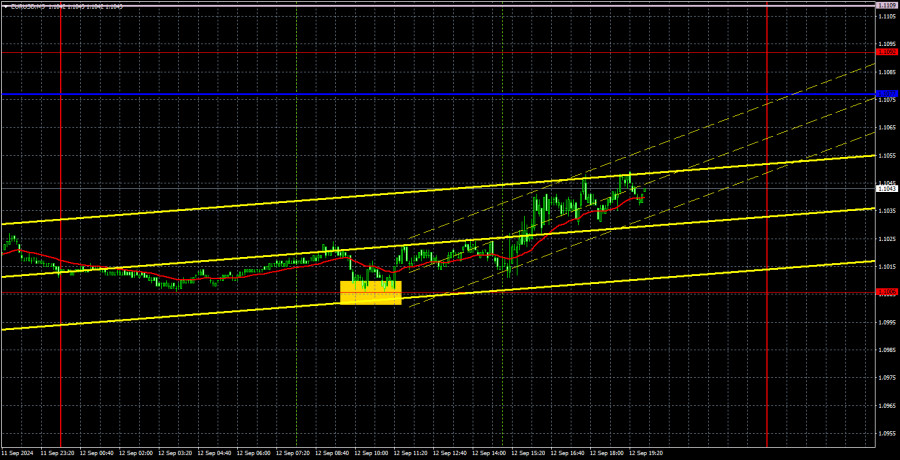
The EUR/USD pair showed no desire to move on Thursday. Volatility barely exceeded 40 pips. And this was on the day of the European Central Bank meeting and Christine Lagarde's speech. And on the day when the ECB lowered key interest rates for the second time! Moreover, the euro price rose due to the ECB's decision to ease monetary policy! That's all you need to know about the logic of Thursday's movements. The euro has been correcting for several weeks, but there's still no sense that it has begun a downward trend. The pair corrected by 200 pips and failed to overcome the psychological level of 1.1000. For now, the dollar's situation is being saved by the trend line and the Ichimoku indicator lines. These are located above the price, so the downward trend remains intact. Since the EUR/USD pair has never been super-volatile, one might assume everything is proceeding as usual. But we still don't see the market eager to buy the US currency.
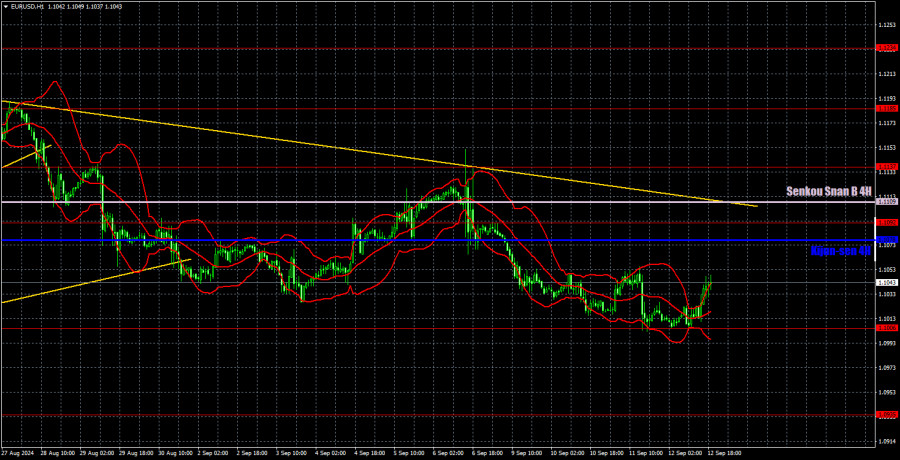
Now, we should expect the pair to rise to the Kijun-sen line. Near this line lie two other lines that currently support the bears. We will see another round of illogical growth in the euro if these are overcome.
In yesterday's 5-minute time frame, there was one reasonably good trading signal to buy. The price bounced off the 1.1006 level and moved upward for the rest of the day. The movement was weak, but even such a move allowed traders to profit from a long position. In principle, it could have been closed anywhere.
COT report:

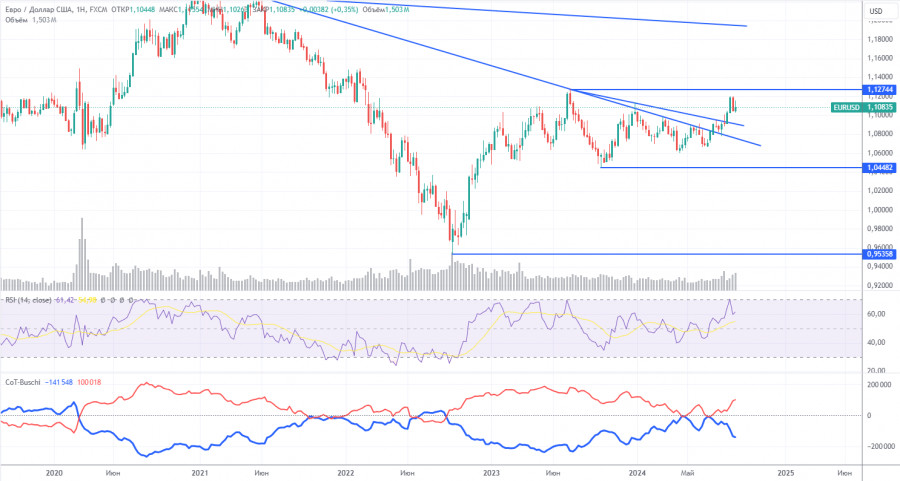
The latest COT report is dated September 3. The illustration above clearly shows that the net position of non-commercial traders has remained bullish for a long time. The bears' attempt to take over failed miserably. The net position of non-commercial traders (red line) declined in the second half of 2023 and the first of 2024, while commercial traders (blue line) grew. Currently, professional players are again increasing their long positions.
We also still do not see any fundamental factors supporting the strengthening of the euro. Technical analysis indicates that the price is in a consolidation phase—in other words, a flat. In the weekly time frame, it is clear that since December 2022, the pair has been trading between levels 1.0448 and 1.1274. In other words, we have moved from a seven-month flat into an 18-month one.
At the moment, the red and blue lines are slightly moving away from each other, which indicates that long positions on the euro are increasing. However, such changes cannot be the basis for long-term conclusions within a flat market. During the last reporting week, the number of long positions in the non-commercial group decreased by 2,400, while the number of short positions fell by 9,600. Accordingly, the net position increased by another 7,200. Yet, there is still potential for the euro to fall.
Analysis of EUR/USD 1H

In the hourly time frame, the EUR/USD pair finally has a real chance to end the baseless upward trend from eight months to two years. A new downtrend has formed, which is currently short-term. Since the Federal Reserve meeting is still a week away, the market could resume the reckless selling of the US currency. However, some technical grounds exist to expect a decline in the pair for now. The price is below the Ichimoku indicator line, which opens up at least some prospects for the US dollar.
For September 13, we highlight the following levels: 1.0658–1.0669, 1.0757, 1.0797, 1.0843, 1.0889, 1.0935, 1.1006, 1.1092, 1.1137, 1.1185, 1.1234, 1.1274, as well as the Senkou Span B (1.1114) and Kijun-sen (1.1085) lines. The Ichimoku indicator lines can move during the day, so this should be considered when identifying trading signals. Remember to set a Stop Loss to break even if the price has moved in the intended direction by 15 pips. This will protect you against potential losses if the signal turns out to be false.
On Friday, a secondary industrial production report will be published in the European Union and, in the US, the secondary Consumer Sentiment Index from the University of Michigan. The market has again fallen into hibernation; volatility is decreasing, so we do not expect strong movements today. Unfortunately, the pair is again starting to trade illogically and is practically ceasing to move.
Explanation of illustrations:
Support and resistance levels: Thick red lines near which the trend may end.
Kijun-sen and Senkou Span B lines: These Ichimoku indicator lines, transferred from the 4-hour timeframe to the hourly chart, are strong lines.
Extreme levels: Thin red lines from which the price previously bounced. These provide trading signals.
Yellow lines: Trend lines, trend channels, and other technical patterns.
Indicator 1 on COT charts: The net position size for each category of traders
The material has been provided by InstaForex Company - www.instaforex.com #


 Download NOW!
No comments:
Post a Comment