
Analysis of EUR/USD 5M
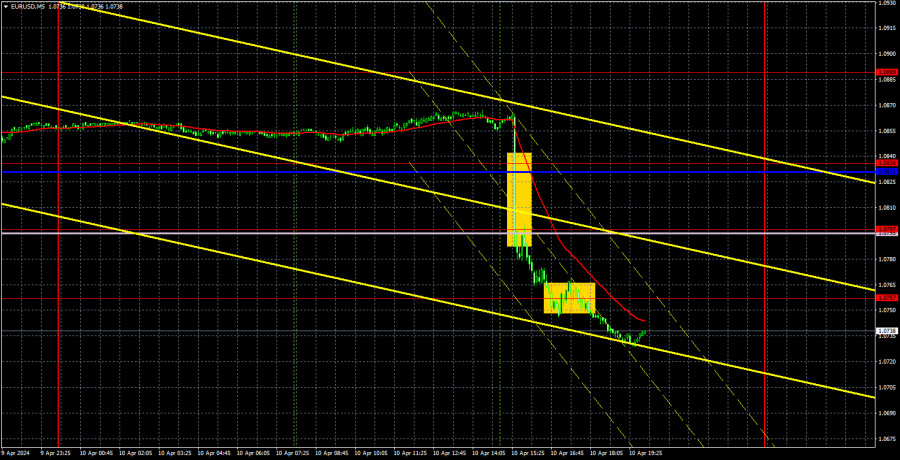
EUR/USD plummeted on Wednesday. The euro fell after the US inflation report showed that consumer prices picked up 0.1% more than anticipated. Some might say that such a small deviation from the forecast shouldn't provoke such a strong movement, but we strongly disagree with this. The fact is that the euro has only managed to show a gradual decline in recent months despite the fundamental and macroeconomic backdrop going against it. For instance, last week, the euro exhibited an illogical upward movement when practically all the important reports from the US turned out to be stronger than expected. Therefore, we strongly believe that the euro is overvalued, and the market severely underestimates the dollar. Yesterday, market participants simply couldn't hold back and started opening short positions en masse, as it is now clear that even in June, the Federal Reserve will not dare to lower rates.
Moreover, it is now completely unclear when the rate cut will take place. We have repeatedly pointed out that the market is rushing with its dovish expectations, and this is why it refuses to buy the dollar. As we can see, everything is falling into place now. The US currency can continue to strengthen up to parity with the euro.
Although yesterday's movement was very volatile, it was practically useless for traders. The pair sharply fell, and the price broke through the levels of 1.0836 and 1.0797, as well as the Ichimoku indicator lines, in just five minutes. Therefore, when a sell signal formed, the pair had already dropped by about 70 pips. Nevertheless, traders could still open short positions, and the pair continued to drop, falling by another 50 pips by the evening. Traders could have earned 50 pips by following our advice.
COT report:
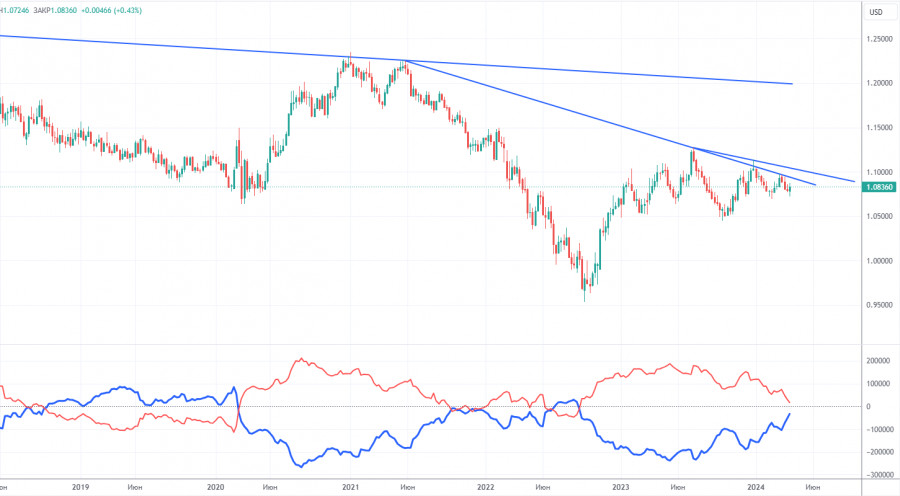
The latest COT report is dated March 26. The net position of non-commercial traders has been bullish for quite some time. Basically, the number of long positions in the market is higher than the number of short positions. However, at the same time, the net position of non-commercial traders (red line) has been decreasing in recent months, while that of commercial traders (blue line) has been increasing. This shows that market sentiment is turning bearish, as speculators increasingly sell the euro. Furthermore, we don't see any fundamental factors that can support the euro's strength, while technical analysis also suggests a downtrend. Three descending trend lines on the weekly chart indicate that there's a good chance of extending the decline.
At present, the red and blue lines are moving towards each other (indicating a trend reversal after a rise). Therefore, we believe that the euro will fall further. During the last reporting week, the number of long positions for the non-commercial group decreased by 2,200, while the number of short positions increased by 15,000. Accordingly, the net position decreased by 17,200. The number of buy contracts is higher than the number of sell contracts among non-commercial traders by only 31,000 (previously 48,000).
Analysis of EUR/USD 1H
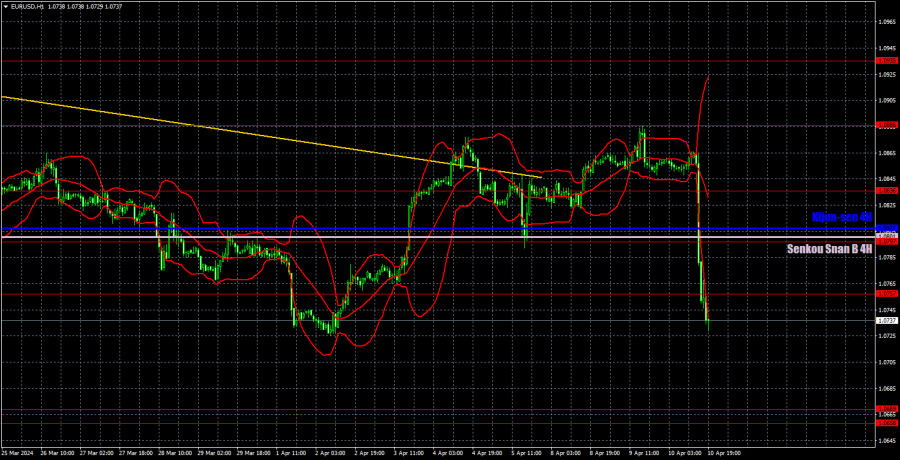
On the 1-hour chart, EUR/USD resumed its downward trend. All it took was one inflation report from the US, which showed that consumer prices had accelerated. Since expectations for an interest rate cut by the Federal Reserve have significantly decreased, the US dollar may be able and should continue to rise. Of course, such strong movements will not happen every day, but today's results will be influenced by the European Central Bank meeting. And this is potentially another bearish factor for the EUR/USD pair.
On April 11, we highlight the following levels for trading: 1.0530, 1.0581, 1.0658-1.0669, 1.0757, 1.0797, 1.0836, 1.0886, 1.0935, 1.1006, 1.1092, as well as the Senkou Span B line (1.0801) and the Kijun-sen line (1.0807). The Ichimoku indicator lines can move during the day, so this should be taken into account when identifying trading signals. Don't forget to set a Stop Loss to breakeven if the price has moved in the intended direction by 15 pips. This will protect you against potential losses if the signal turns out to be false.
Today, attention now turns to the ECB meeting, and ECB President Christine Lagarde's news conference follows later. We believe that she will become even more dovish, which could well trigger a new round of downward movement. In the US, only secondary events are expected, such as the Producer Price Index (which has lost significance after yesterday's inflation report) and initial jobless claims.
Description of the chart:
Support and resistance levels are thick red lines near which the trend may end. They do not provide trading signals;
The Kijun-sen and Senkou Span B lines are the lines of the Ichimoku indicator, plotted to the 1H timeframe from the 4H one. They provide trading signals;
Extreme levels are thin red lines from which the price bounced earlier. They provide trading signals;
Yellow lines are trend lines, trend channels, and any other technical patterns;
Indicator 1 on the COT charts is the net position size for each category of traders;
The material has been provided by InstaForex Company - www.instaforex.com #


 Download NOW!
No comments:
Post a Comment