Forecast for AUD/USD on August 5, 2024

#

AUD/USD

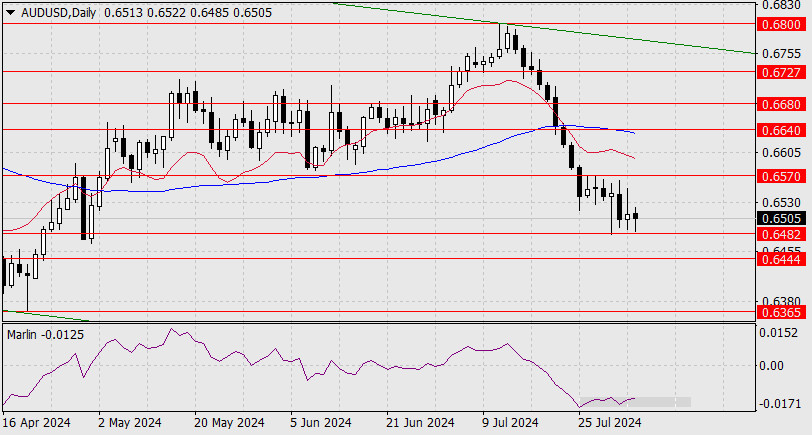
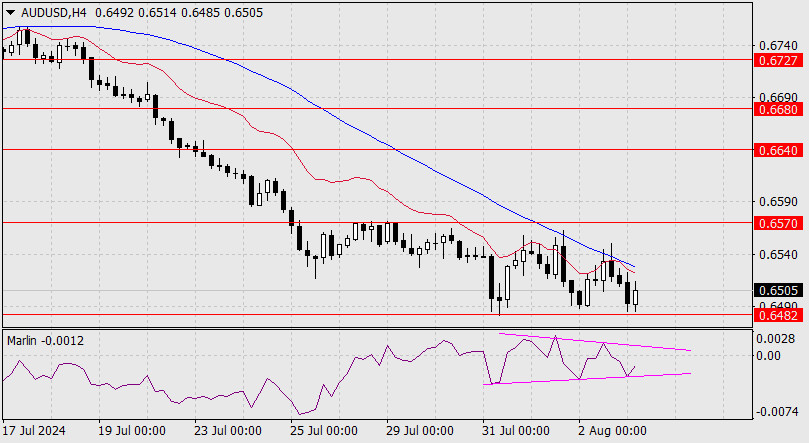
On Friday, the Australian dollar again, as in the last three days, tried to reach the target resistance at 0.6570 but failed. This morning, the price is already attacking the support at 0.6482. But for now, this only shows the intention.

analytics66b03ff93344c.jpg

The Marlin oscillator is moving in a narrow sideways range, and the price is consolidating above the 0.6482 level. Breaking through this level would open up a target at 0.6444. Subsequently, the price will try to extend its decline to the target level of 0.6365 – the April 19 low. On the 4-hour chart, the price is pressing against the support at 0.6482 by the balance and MACD indicator lines.

analytics66b0400c70325.jpg

The Marlin oscillator converges into a neutral range wedge (around the zero line). The breakout from the wedge will most likely be downwards. However, if it is a bullish breakout above the price of 0.6540, then the 0.6570 level will be attacked. A consolidation above it would allow the price to advance towards 0.6640 and also to the MACD line on the daily chart.

The material has been provided by InstaForex Company - www.instaforex.com #

Trading plan for GBP/USD on August 5. Simple tips for beginners

Analyzing Friday's trades:


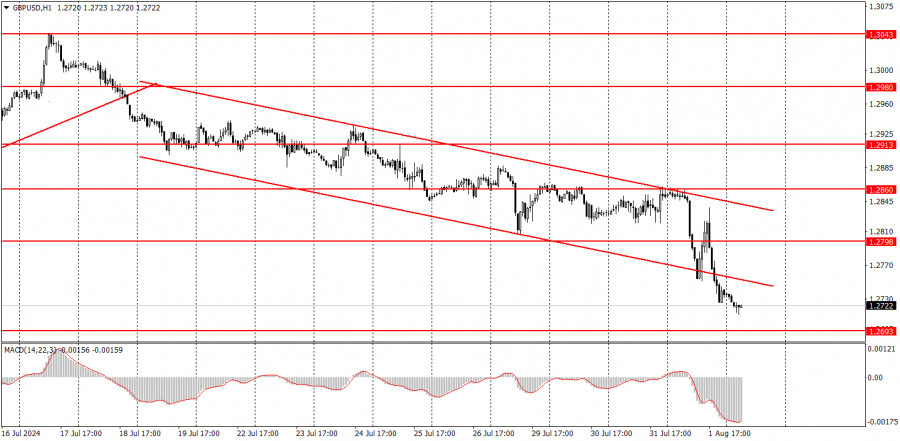
GBP/USD on 1H chart


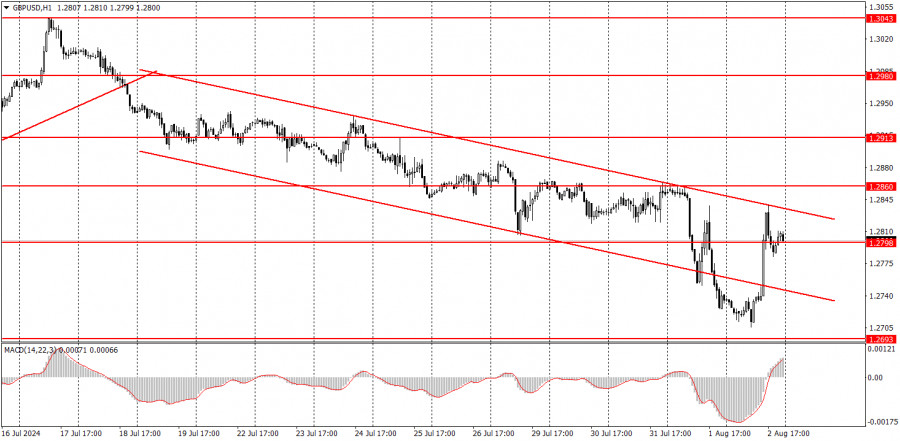
The GBP/USD pair also showed clear signs of strength on Friday, but it stayed within a descending channel due to a drop on Thursday. Thus, the downward trend remains intact, and the correction started on Friday. If we do not expect further growth for the euro, then even less so for the British pound. The Bank of England only began easing monetary policy. It is illogical to expect growth in a currency whose central bank is lowering rates. We are not asserting that the pound cannot start a new rise under any circumstances. We are just saying that such a move would not be logical. In any case, the price must consolidate above the descending channel to identify a new upward trend.

GBP/USD on 5M chart


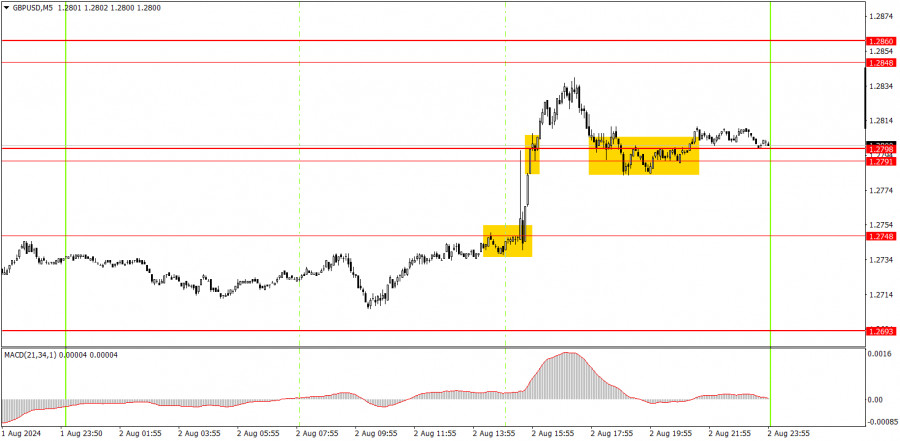
Several trading signals were formed in the 5-minute time frame on Friday but were very difficult to execute. The first buy signal was formed during the release of economic reports in the U.S. The price immediately soared from the level of 1.2748, making it physically very difficult to enter the market. Subsequently, the price stabilized above the area of 1.2791-1.2798, but by then, the price had moved more than 100 pips from the day's low. We believe entering the market on such a signal was not advisable. At the end of the day, the price tried to consolidate below the area of 1.2791-1.2798, but it was unsuccessful.

Trading tips on Monday:


GBP/USD has a good chance of continuing its downward trend in the hourly time frame. The British pound is still overbought, the dollar is undervalued, and the BoE has started lowering its borrowing costs—what more is needed for the British currency to keep falling? The macro data once again spoiled the perfect picture for the dollar. However, at the same time, disappointing US reports will not come every day, and the UK also does not always provide good data. Yet, the fundamental background is no less important than the macroeconomic one.

On Monday, novice traders can trade from 1.2791-1.2798. A bounce from it could lead to new long positions targeting 1.2848. A consolidation below indicates a new drop.

The key levels to consider on the 5M timeframe are 1.2605-1.2633, 1.2684-1.2693, 1.2748, 1.2791-1.2798, 1.2848-1.2860, 1.2913, 1.2980-1.2993, 1.3043, 1.3102-1.3107, 1.3145. On Monday, July's final estimates of the Services PMI data will be published in the UK and the US. However, a more important ISM index for the service sector will also be published in the US.

Basic rules of a trading system:


1) The strength of a signal is determined by the time it took for the signal to form (bounce or level breakthrough). The shorter the time required, the stronger the signal.

2) If two or more trades around a certain level are initiated based on false signals, subsequent signals from that level should be ignored.

3) In a flat market, any currency pair can produce multiple false signals or none at all. In any case, it's better to stop trading at the first signs of a flat market.

4) Trades should be opened between the start of the European session and mid-way through the U.S. session. All trades must be closed manually after this period.

5) In the hourly time frame, trades based on MACD signals are only advisable amidst substantial volatility and an established trend, confirmed either by a trendline or trend channel.

6) If two levels are too close to each other (from 5 to 20 pips), they should be considered as a support or resistance zone.

7) After moving 15 pips in the intended direction, the Stop Loss should be set to break-even.

What's on the charts:


Support and Resistance price levels can serve as targets when buying or selling. You can place Take Profit levels near them.

Red lines represent channels or trend lines that depict the current trend and indicate the preferred trading direction.

The MACD (14,22,3) indicator, encompassing both the histogram and signal line, acts as an auxiliary tool and can also be used as a source of signals.

Important speeches and reports (always noted in the news calendar) can profoundly influence the price dynamics. Hence, trading during their release calls for heightened caution. It may be reasonable to exit the market to prevent abrupt price reversals against the prevailing trend.

Beginners should always remember that not every trade will yield profit. Establishing a clear strategy, coupled with effective money management, is key to long-term success in trading.Pentru mai multe detalii, va invitam sa vizitati stirea originala.
Trading plan for GBP/USD on August 5. Simple tips for beginners

#

Analyzing Friday's trades:

GBP/USD on 1H chart

analytics66aefd0387dcd.jpg

The GBP/USD pair also showed clear signs of strength on Friday, but it stayed within a descending channel due to a drop on Thursday. Thus, the downward trend remains intact, and the correction started on Friday. If we do not expect further growth for the euro, then even less so for the British pound. The Bank of England only began easing monetary policy. It is illogical to expect growth in a currency whose central bank is lowering rates. We are not asserting that the pound cannot start a new rise under any circumstances. We are just saying that such a move would not be logical. In any case, the price must consolidate above the descending channel to identify a new upward trend.

GBP/USD on 5M chart

analytics66aefd0c25cc1.jpg

Several trading signals were formed in the 5-minute time frame on Friday but were very difficult to execute. The first buy signal was formed during the release of economic reports in the U.S. The price immediately soared from the level of 1.2748, making it physically very difficult to enter the market. Subsequently, the price stabilized above the area of 1.2791-1.2798, but by then, the price had moved more than 100 pips from the day's low. We believe entering the market on such a signal was not advisable. At the end of the day, the price tried to consolidate below the area of 1.2791-1.2798, but it was unsuccessful.

Trading tips on Monday:

GBP/USD has a good chance of continuing its downward trend in the hourly time frame. The British pound is still overbought, the dollar is undervalued, and the BoE has started lowering its borrowing costs—what more is needed for the British currency to keep falling? The macro data once again spoiled the perfect picture for the dollar. However, at the same time, disappointing US reports will not come every day, and the UK also does not always provide good data. Yet, the fundamental background is no less important than the macroeconomic one.

On Monday, novice traders can trade from 1.2791-1.2798. A bounce from it could lead to new long positions targeting 1.2848. A consolidation below indicates a new drop.

The key levels to consider on the 5M timeframe are 1.2605-1.2633, 1.2684-1.2693, 1.2748, 1.2791-1.2798, 1.2848-1.2860, 1.2913, 1.2980-1.2993, 1.3043, 1.3102-1.3107, 1.3145. On Monday, July's final estimates of the Services PMI data will be published in the UK and the US. However, a more important ISM index for the service sector will also be published in the US.

Basic rules of a trading system:

1) The strength of a signal is determined by the time it took for the signal to form (bounce or level breakthrough). The shorter the time required, the stronger the signal.

2) If two or more trades around a certain level are initiated based on false signals, subsequent signals from that level should be ignored.

3) In a flat market, any currency pair can produce multiple false signals or none at all. In any case, it's better to stop trading at the first signs of a flat market.

4) Trades should be opened between the start of the European session and mid-way through the U.S. session. All trades must be closed manually after this period.

5) In the hourly time frame, trades based on MACD signals are only advisable amidst substantial volatility and an established trend, confirmed either by a trendline or trend channel.

6) If two levels are too close to each other (from 5 to 20 pips), they should be considered as a support or resistance zone.

7) After moving 15 pips in the intended direction, the Stop Loss should be set to break-even.

What's on the charts:

Support and Resistance price levels can serve as targets when buying or selling. You can place Take Profit levels near them.

Red lines represent channels or trend lines that depict the current trend and indicate the preferred trading direction.

The MACD (14,22,3) indicator, encompassing both the histogram and signal line, acts as an auxiliary tool and can also be used as a source of signals.

Important speeches and reports (always noted in the news calendar) can profoundly influence the price dynamics. Hence, trading during their release calls for heightened caution. It may be reasonable to exit the market to prevent abrupt price reversals against the prevailing trend.

Beginners should always remember that not every trade will yield profit. Establishing a clear strategy, coupled with effective money management, is key to long-term success in trading.

The material has been provided by InstaForex Company - www.instaforex.com #

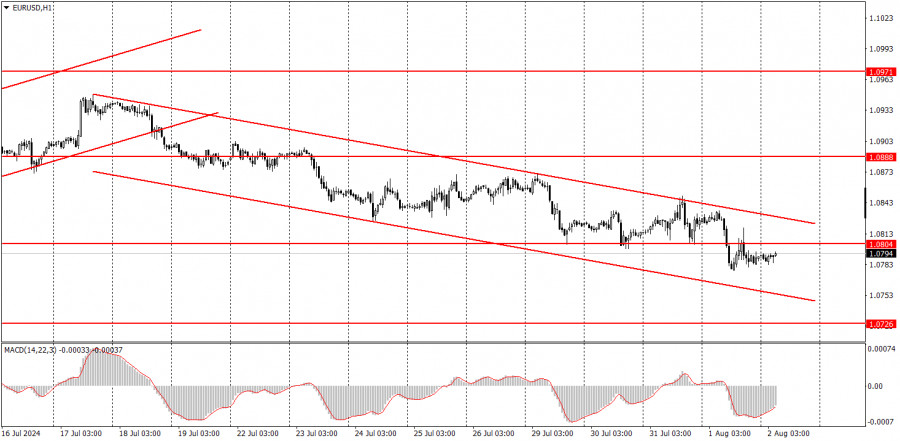
Analysis of EUR/USD on August 2, 2024

The wave pattern of the EUR/USD on the 4-hour chart has changed. Analyzing the entire trend segment that began in September 2022, when the European currency fell to 0.9530, we are now within a series of upward waves. However, within this segment, even the larger scale waves are quite difficult to distinguish. In other words, there is no clear, impulsive trend. We constantly see alternations of three- and five-wave corrective structures. Currently, the market has failed even to construct a clear downward three-wave pattern from the peak reached last July. First, there was a downward wave that overlapped the lows of previous waves, followed by a significant upward wave. Now, for the seventh consecutive month, an indistinct pattern is emerging.

Since January 2024, I have identified only two three-wave a-b-c patterns, with the turning point occurring on April 16. Therefore, the primary point to understand is that there is no trend right now. After the completion of the current wave c, the construction of a new three-wave pattern downward may begin. The trend segment from April 16 might take a five-wave form, but it would still be corrective. Under such circumstances, I do not anticipate a prolonged rise of the euro currency.

The EUR/USD rate increased by 115 basis points on Friday, and the day is not yet over. In recent weeks, I have regularly said that neither the euro nor the dollar currently has the informational potential for an impulsive trend. First, this is indicated by the wave markup, which has been building only corrective structures for a very long time. Second, the ECB has begun easing monetary policy, while the Fed has not, which puts the US currency in more favorable conditions. I also mentioned that in the last three months, American statistics on the labor market, unemployment, and business activity have often been weak. But at the same time, I kept in mind that this would not continue forever. And today, when everything seemed to be lining up in favor of the dollar, new reports on the labor market and unemployment came out.

I won't even discuss yesterday's ISM Manufacturing Business Activity Index – the market practically ignored it, but it still turned out weaker than forecasts. However, on Friday, the Nonfarm Payrolls amounted to only 114,000 against market expectations of 175,000, and the unemployment rate rose to 4.3% against forecasts of 4.1%. Clearly, these two reports had a dramatic impact on the market, causing an immediate collapse in demand for the US currency and disrupting the existing wave pattern. It's not completely broken, and the decline in the instrument may resume. But today's reports are clearly not the last negative news from America.

General Conclusions

Based on the analysis of EUR/USD, the instrument has moved to constructing a series of corrective structures. From the current positions, an increase may resume within a five-wave corrective structure. However, now, a scenario with the construction of a downward wave d is more likely. It is also possible to build a new downward (and also corrective) series of waves with targets located below the 6-figure mark if the upward wave series a-b-c remains three-wave. The instrument may reach the low of wave b. A successful attempt to break through this low will indicate a transition to constructing a downward wave set.

On a larger wave scale, it is also evident that the wave markup is becoming more complex. Probably, an ascending wave set awaits us, but its length and structure are now difficult to imagine.

Main Principles of My Analysis:

* Wave structures should be simple and understandable. Complex structures are difficult to play out and often carry changes.
* If there is no confidence in what is happening in the market, it's better to avoid entering it.
* There can never be 100% confidence in the direction of movement. Remember protective Stop Loss orders.
* Wave analysis can be combined with other types of analysis and trading strategies.


Pentru mai multe detalii, va invitam sa vizitati stirea originala.

USD/JPY: Simple Trading Tips for Beginners for August 2nd (U.S. Session)

Analysis of Trades and Tips for Trading the Japanese Yen

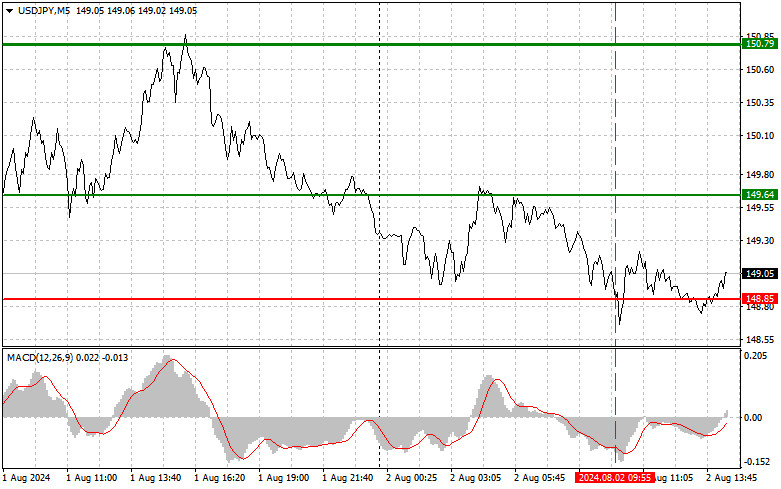
The price test at 148.85 occurred when the MACD indicator had significantly moved downward from the zero mark, which limited the pair's downward potential. For this reason, I chose not to sell dollars. Selling at the current level is quite risky from a technical standpoint because we have moved significantly downward over the week without any substantial correction. Upcoming data from the U.S. labor market may help the dollar recover. In the second half of the day, we will have to deal with the following fundamental statistics: the unemployment level, changes in the number of employed in the U.S. non-agricultural sector, changes in the number of employed in the private sector, changes in the average hourly wage, which are also very important, and the proportion of the economically active population. Only extremely weak statistics are likely to lead to a new wave of decline in USD/JPY. As for the intraday strategy, I plan to act based on the implementation of scenarios No. 1 and No. 2.

Buy Signal

Scenario #1: I plan to buy USD/JPY today when the entry point reaches the area of 149.27 (green line on the chart), with a target of rising to the level of 150.05 (thicker green line on the chart). At the 150.05 area, I will exit the buys and open sales in the opposite direction (calculation of a movement of 30-35 points in the opposite direction from the level). Expecting a strong rise in the pair today will only be feasible in the case of very strong U.S. labor market data. Important, before buying, make sure that the MACD indicator is above the zero mark and that it is just starting to rise from there.

Scenario #2: I also plan to buy USD/JPY today in the case of two consecutive tests of the price at 148.70 when the MACD indicator is in the oversold area. This will limit the downward potential of the pair and lead to a market reversal upwards. A rise to the levels of 149.27 and 150.05 can be expected.

Sell Signal

Scenario #1: I plan to sell USD/JPY today after updating the level of 148.70 (red line on the chart), which will lead to a quick decline in the pair. The key target for sellers will be the level of 147.86, where I will exit the sales and also immediately open buys in the opposite direction (calculation of a movement of 20-25 points in the opposite direction from the level). Pressure on the pair will return in case of a failed attempt to break above 149.27 and weak U.S. statistics. Important, before selling, make sure that the MACD indicator is below the zero mark and that it is just starting its decline from there.

Scenario #2: I also plan to sell USD/JPY today in the case of two consecutive tests of the price at 149.27 when the MACD indicator is in the overbought area. This will limit the upward potential of the pair and lead to a downward market reversal. A decline to the levels of 148.70 and 147.86 can be expected.

What's on the Chart:

* Thin green line: Entry price for buying the trading instrument.
* Thick green line: Presumed price where you can set Take Profit or independently secure profits, as further growth above this level is unlikely.
* Thin red line: Entry price for selling the trading instrument.
* Thick red line: Presumed price where you can set Take Profit or independently secure profits, as further decline below this level is unlikely.
* MACD Indicator: It's important to be guided by overbought and oversold zones when entering the market.


Important: For beginners in the Forex market, it is crucial to be cautious when making market entry decisions. It's best to stay out of the market before the release of important fundamental reports to avoid sharp fluctuations in exchange rates. If you decide to trade during news releases, always set stop orders to minimize losses. You need to place stop orders to avoid losing your entire deposit, especially if you do not use money management and trade large volumes.

Remember: For successful trading, you must have a clear trading plan, like the one I have presented above. Making spontaneous trading decisions based on the current market situation is initially a losing strategy for an intraday trader.Pentru mai multe detalii, va invitam sa vizitati stirea originala.

GBP/USD: Simple Trading Tips for Beginners for August 2nd (U.S. Session)

Analysis of Trades and Tips for Trading the British Pound

The price test at 1.2709 occurred when the MACD indicator had moved significantly downward from the zero mark, limiting the further downward potential of the pound. Therefore, I decided not to sell at the lows, fearing a market reversal in the second half of the day. Indeed, there will be quite a few reasons for this, as data on the unemployment level and changes in the number of employed in the U.S. non-agricultural sector may change the market dynamics. Economists expect weak statistics, which will lead to a rise in the pound at the end of the week, anticipating a correction after yesterday's significant drop due to the Bank of England's interest rate cut. Regarding the intraday strategy, I plan to act based on the implementation of scenario No. 1, even disregarding the MACD indicator readings, as I expect strong and directed movements.

Buy Signal

Scenario #1: Today, I plan to buy the pound when the entry point reaches the area of 1.2760 (green line on the chart) with a target of rising to the level of 1.2802 (thicker green line on the chart). At the 1.2802 area, I will exit the buys and open sales in the opposite direction (calculation of a movement of 30-35 points in the opposite direction from the level). A rise in the pound can be expected following weak U.S. statistics today. Important, before buying, make sure that the MACD indicator is above the zero mark and beginning to rise.

Scenario #2: I also plan to buy the pound today in case of two consecutive tests of the price at 1.2730 when the MACD indicator is in the oversold area. This will limit the downward potential of the pair and lead to a market reversal upwards. A rise to the opposite levels of 1.2760 and 1.2802 can be expected.

Sell Signal

Scenario #1: I plan to sell the pound today after updating the level of 1.2730 (red line on the chart), which will lead to a quick decline in the pair. The key target for sellers will be the level of 1.2683, where I will exit the sales and also immediately open buys in the opposite direction (calculation of a movement of 20-25 points in the opposite direction from the level). Sellers will show themselves only after strong U.S. data. Important, before selling, make sure that the MACD indicator is below the zero mark and beginning to decline.

Scenario #2: I also plan to sell the pound today in case of two consecutive tests of the price at 1.2760 when the MACD indicator is in the overbought area. This will limit the upward potential of the pair and lead to a downward market reversal. A decline to the opposite levels of 1.2730 and 1.2683 can be expected.

What's on the Chart:

* Thin green line: Entry price for buying the trading instrument.
* Thick green line: Presumed price where you can set Take Profit or independently secure profits, as further growth above this level is unlikely.
* Thin red line: Entry price for selling the trading instrument.
* Thick red line: Presumed price where you can set Take Profit or independently secure profits, as further decline below this level is unlikely.
* MACD Indicator: It's important to be guided by overbought and oversold zones when entering the market.


Important: For beginners in the Forex market, it is crucial to be very cautious when making market entry decisions. It's best to stay out of the market before the release of important fundamental reports to avoid sharp fluctuations in exchange rates. If you decide to trade during news releases, always set stop orders to minimize losses. You need to place stop orders to avoid losing your entire deposit, especially if you do not use money management and trade large volumes.

Remember: For successful trading, you must have a clear trading plan, like the one I have presented above. Making spontaneous trading decisions based on the current market situation is initially a losing strategy for an intraday trader.Pentru mai multe detalii, va invitam sa vizitati stirea originala.

EUR/USD: Trading Plan for the U.S. Session on August 2 (Analysis of Morning Trades). Euro Recovers Ahead of Key Data

Back
Trading plan


Back
Trading plan


EUR/USD: Trading Plan for the U.S. Session on August 2 (Analysis of Morning Trades). Euro Recovers Ahead of Key Data


In my morning forecast, I focused


The premium article will be available in
00:00:00

02.08.2024 02:12 PM


The premium article will be available in00:00:00

02.08.2024 02:12 PM


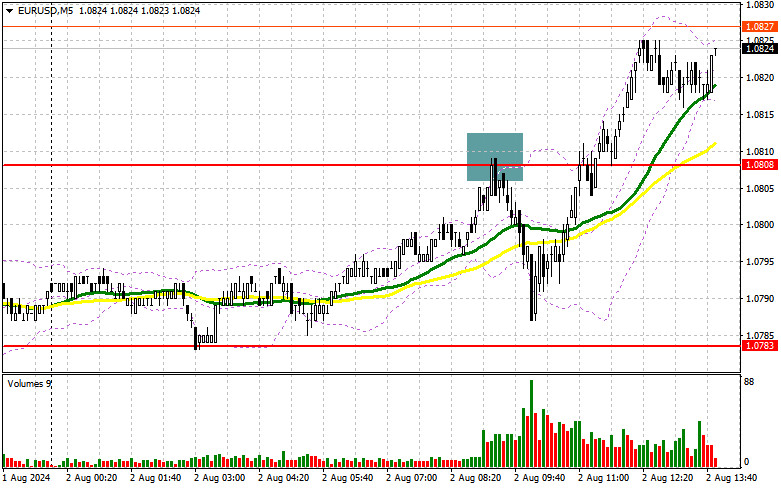
In my morning forecast, I focused on the 1.0808 level and planned to base my market entry decisions on this level. Let's look at the 5-minute chart and see what happened. The rise and subsequent false breakout at this level created an entry point for short positions, leading to a decline of more than 20 points. The technical picture for the second half of the day was minimally revised.To open long positions on EUR/USD:In the second half of the day,


Fresh articles are available only to premium users


Read analytics in early access, getting information first
Get

Pentru mai multe detalii, va invitam sa vizitati stirea originala.

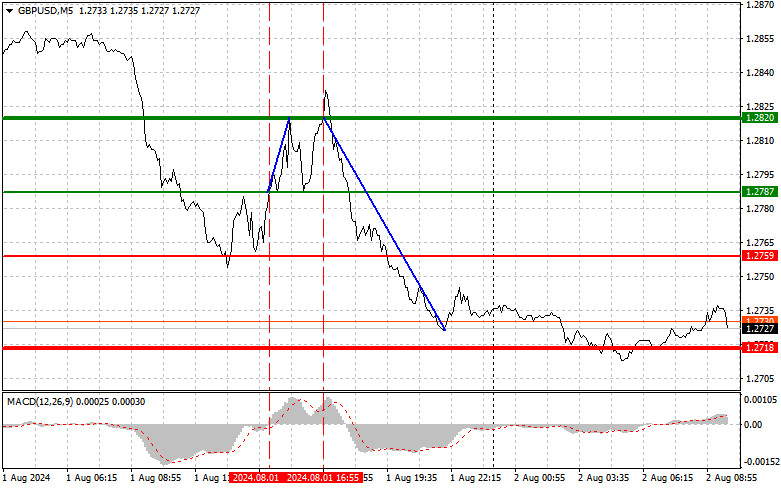
GBP/USD: simple trading tips for beginners for the European session on August 2

Analysis of trades and tips on on GBP/USD

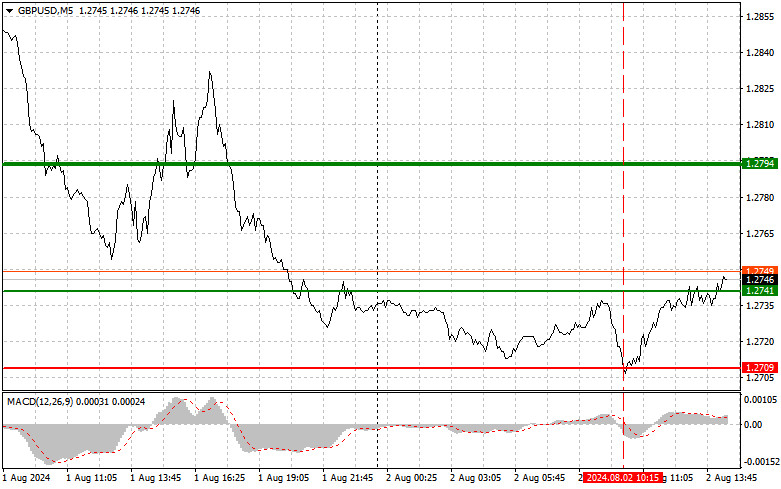
The price test of 1.2787 occurred when the MACD indicator started moving up from the zero mark, confirming the correct entry point for buying the pound. As a result, we observed an increase of 35 pips around 1.2820. Bank of England Governor Andrew Bailey's statement triggered the pair's rise, but pressure returned. The price test of 1.2820, where I planned to sell immediately on a bounce according to scenario #2, made it possible to take another approximately 50 pips profit, as despite weak U.S. data, pressure on the pair returned very quickly. Today, in the first half of the day, only a speech by Bank of England MPC member Huw Pill is expected, so it's better to continue trading along the trend in anticipation of testing the monthly low even before the release of the U.S. labor market data. As for the intraday strategy, I will rely more on realizing scenarios No. 1 and 2.

Buy signals

Scenario No 1. Today, I plan to buy the pound when the price reaches the entry point at 1.2741, plotted by the green line on the chart, with the goal of rising to 1.2794, plotted by the thicker green line on the chart. Around 1.2794, I plan to exit long positions and sell the pound in the opposite direction, counting on a movement of 30-35 pips from the level. We can only count on a strong pound growth in the first half of the day within the framework of a bullish correction. Important: Before buying, ensure the MACD indicator is above the zero mark and starting to rise from it.

Scenario No 2. I also plan to buy the pound today if the price at 1.2709 is tested twice consecutively when the MACD indicator is in the oversold area. This will limit the pair's downward potential and lead to a reverse market upturn. One can expect growth to the opposite levels of 1.2741 and 1.2794.

Sell signals

Scenario No 1. Today, I plan to sell the pound after testing the level of 1.2709 plotted by the red line on the chart, which will lead to a rapid decline in GBP/USD. The key target for sellers will be 1.2655, where I will exit short positions and immediately open long positions in the opposite direction (expecting a movement of 20-25 pips in the opposite direction from that level). You can sell the pound if buyers are not active near the intraday high in the development of the downtrend. Important: Before selling, make sure that the MACD indicator is below the zero mark and is just starting to decline from it.

Scenario No 2. I also plan to sell the pound today in case of two consecutive price tests of 1.2741 when the MACD indicator is in the overbought area. This will limit the pair's upward potential and lead to a reverse market downturn. One can expect a decline to the opposite levels of 1.2709 and 1.2655.

What's on the chart:

Thin green line: the entry price at which you can buy the trading instrument.

Thick green line: the estimated price at which you can set Take Profit or manually close positions, as further growth above this level is unlikely.

Thin red line: the entry price at which you can sell the trading instrument.

Thick red line: an estimated price at which you can place Take Profit or manually close positions, as further decline below this level is unlikely.

MACD indicator: when entering the market, it is essential to be guided by overbought and oversold zones.

Important: Novice traders in the forex market must be cautious when deciding to enter the market. It is best to stay out of the market before important fundamental reports are released to avoid getting caught in sharp price fluctuations. If you decide to trade during news releases, always place stop orders to minimize losses. You must set stop orders to avoid losing your entire deposit, especially if you don't use money management and trade in large volumes.

Remember, a clear trading plan, like the one I've outlined, is essential for successful trading. Making impulsive decisions based on the current market situation is a losing strategy for novice intraday traders.Pentru mai multe detalii, va invitam sa vizitati stirea originala.

Key events on August 2: fundamental analysis for beginners

Analysis of macroeconomic reports:


A few macroeconomic events are planned for Friday, but all are significant. There will be no important report in the Eurozone, Germany, and the UK. However, in the U.S., at least two reports are set to be released that could significantly impact the movement of both currency pairs. These reports are on non-farm payrolls and the unemployment rate. Recall that these reports have only exerted pressure on the dollar over the past three months. However, the market was bullish then, and the situation has changed. The European Central Bank and the Bank of England have begun to ease monetary policy, a background factor for strengthening the U.S. dollar. The conclusion: if U.S. data disappoints the market today, it will be only a matter of a bullish correction. If U.S. reports finally meet the forecasts, both pairs could continue to fall.

Analysis of fundamental events:


Among the fundamental events for Friday, the speech by the Bank of England's Chief Economist Huw Pill stands out. It could be quite interesting, but the market is currently focused on the Bank of England's first rate cut. Thus, Pill's speech will be overshadowed by this event, as well as by the U.S. labor market and unemployment reports.

General conclusions:


Today, the U.S. dollar could continue to rise. If the U.S. labor market and unemployment data finally please experts, both pairs could fall even further. These two reports are the pivotal events of the day. We anticipate the dollar will continue its upward trajectory over the next two weeks.

Basic rules of a trading system:


1) The strength of a signal is determined by the time it took for the signal to form (bounce or level breakthrough). The shorter the time required, the stronger the signal.

2) If two or more trades around a certain level are initiated based on false signals, subsequent signals from that level should be ignored.

3) In a flat market, any currency pair can produce multiple false signals or none at all. In any case, it's better to stop trading at the first signs of a flat market.

4) Trades should be opened between the start of the European session and mid-way through the U.S. session. All trades must be closed manually after this period.

5) In the hourly time frame, trades based on MACD signals are only advisable amidst substantial volatility and an established trend, confirmed either by a trendline or trend channel.

6) If two levels are too close to each other (from 5 to 20 pips), they should be considered as a support or resistance zone.

7) After moving 15 pips in the intended direction, the Stop Loss should be set to break-even.

What the charts show:


Support and Resistance price levels can serve as targets when buying or selling. You can place Take Profit levels near them.

Red lines represent channels or trend lines that depict the current trend and indicate the preferred trading direction.

The MACD (14,22,3) indicator, encompassing both the histogram and signal line, acts as an auxiliary tool and can also be used as a source of signals.

Important speeches and reports (always noted in the news calendar) can profoundly influence the price dynamics. Hence, trading during their release calls for heightened caution. It may be reasonable to exit the market to prevent abrupt price reversals against the prevailing trend.

Beginners should always remember that not every trade will yield profit. Establishing a clear strategy, coupled with effective money management, is key to long-term success in trading.Pentru mai multe detalii, va invitam sa vizitati stirea originala.
Trading plan for GBP/USD on August 2. Simple tips for beginners

Analyzing Thursday's trades:


GBP/USD on 1H chart


On Thursday, the GBP/USD pair sustained its decline and finally showed good volatility. The pair moved about 140 pips during the day. Given the Bank of England's decision to cut rates, this decline is likely logical. It seems the market was completely unprepared for such an outcome, although we've repeatedly mentioned that it was oddly expecting a rate cut only from the U.S. The market has been waiting in vain for about seven months, trading as if the Federal Reserve had already eased monetary policy several times. Yesterday, it became clear that the European Central Bank and the BoE would begin monetary easing before the U.S. central bank. Whether the Fed will start cutting rates by September remains an open question. We do not share the market's newfound optimism about easing. In our opinion, the current level of inflation does not support rate cuts in September. Therefore, the dollar may continue to rise steadily.

GBP/USD on 5M chart


Several signals were formed in the 5-minute time frame on Thursday. We want to point out that six signals were immediately formed when the pair showed good volatility. The first sell signal around the 1.2848-1.2860 area resulted in excellent profit. The price fell and approached the 1.2748 level with a 3-pip deviation. A rebound from this level could have been used to open long positions. These should have been closed based on a sell signal around the 1.2791-1.2798 area, and new short positions could have been opened on the same signal. By the end of the day, the pair fell by another 45 pips. In total, about 125 pips could have been earned from the three trades.

Trading tips on Friday:


GBP/USD has a good chance of continuing its downward trend in the hourly time frame. The British pound is still overbought, the dollar is undervalued, and the BoE has started lowering its borrowing costs—what more is needed for the British currency to keep falling? Of course, economic reports from the U.S. could spoil the ideal scenario for the dollar, but we hope the market is now inclined to buy the dollar rather than sell it.

On Friday, novice traders might stay in short positions, but there will be important U.S. data during the American session, so be prepared for a potential upward reversal.

The key levels to consider on the 5M timeframe are 1.2605-1.2633, 1.2684-1.2693, 1.2748, 1.2791-1.2798, 1.2848-1.2860, 1.2913, 1.2980-1.2993, 1.3043, 1.3102-1.3107, and 1.3145. Today, no significant events are scheduled in the UK, but in the U.S., reports on unemployment, the labor market, and wages will be released.

Basic rules of a trading system:


1) The strength of a signal is determined by the time it took for the signal to form (bounce or level breakthrough). The shorter the time required, the stronger the signal.

2) If two or more trades around a certain level are initiated based on false signals, subsequent signals from that level should be ignored.

3) In a flat market, any currency pair can produce multiple false signals or none at all. In any case, it's better to stop trading at the first signs of a flat market.

4) Trades should be opened between the start of the European session and mid-way through the U.S. session. All trades must be closed manually after this period.

5) In the hourly time frame, trades based on MACD signals are only advisable amidst substantial volatility and an established trend, confirmed either by a trendline or trend channel.

6) If two levels are too close to each other (from 5 to 20 pips), they should be considered as a support or resistance zone.

7) After moving 15 pips in the intended direction, the Stop Loss should be set to break-even.

What's on the charts:


Support and Resistance price levels can serve as targets when buying or selling. You can place Take Profit levels near them.

Red lines represent channels or trend lines that depict the current trend and indicate the preferred trading direction.

The MACD (14,22,3) indicator, encompassing both the histogram and signal line, acts as an auxiliary tool and can also be used as a source of signals.

Important speeches and reports (always noted in the news calendar) can profoundly influence the price dynamics. Hence, trading during their release calls for heightened caution. It may be reasonable to exit the market to prevent abrupt price reversals against the prevailing trend.

Beginners should always remember that not every trade will yield profit. Establishing a clear strategy, coupled with effective money management, is key to long-term success in trading.Pentru mai multe detalii, va invitam sa vizitati stirea originala.