Stock markets instantly lose over $6.4 trillion. Heavier losses yet to come

The premium article will be available in00:00:00

06.08.2024 10:46 AM


A sharp plunge in US stocks and the capitalization loss of over $6.4 trillion prompted US policymakers to speak about the economy in a more alarming tone.
It is evident that the pillars that have supported the uptrend on Wall Street for a few years have been shaken. I mean a series of key assumptions priced in by investors worldwide. Many believed that the US economy was unshakable and that artificial intelligence, rapidly gaining strength, would revolutionize business globally. No one


Fresh articles are available only to premium users


Read analytics in early access, getting information first
Get

Pentru mai multe detalii, va invitam sa vizitati stirea originala.

Trading plan for EUR/USD and GBP/USD on August 6, 2024

Back
Trading plan


Back
Trading plan


Trading plan for EUR/USD and GBP/USD on August 6, 2024


The US
dollar remains under selling pressure


The premium article will be available in
00:00:00

06.08.2024 10:25 AM


The premium article will be available in00:00:00

06.08.2024 10:25 AM


The US
dollar remains under selling pressure amidst speculations on the Federal
Reserve's further policy moves. The thing is that investors increased recession
fears. There has been active discussion about the likelihood that the Federal
Reserve might cut the funds rate by 0.50%. Besides, rumors have also emerged that
the central bank might hold an emergency meeting. This is all driven by
mounting fears of the US economy sliding into a recession. Moreover, the
recession is likely to be a profound and prolonged. Unsurprisingly, amid such
fundamentals, the


Fresh articles are available only to premium users


Read analytics in early access, getting information first
Get

Pentru mai multe detalii, va invitam sa vizitati stirea originala.

Forex forecast 08/06/2024: EUR/USD, AUD/USD, Oil and Bitcoin from Sebastian Seliga

We introduce you to the daily updated section of Forex analytics where you will find reviews from forex experts, up-to-date monitoring of financial information as well as online forecasts of exchange rates of the US dollar, euro, ruble, bitcoin, and other currencies for today, tomorrow and this trading week.


Video Agenda:

00:00 INTRO

00:13 Totay's key events: Household Spending, RBA Interest Rate Decision, Retail Sales, Trade Balance, EIA Short-Term Energy Outlook
02:29 EUR/USD

04:29 AUD/USD

06:38 OIL

08:11 BTC/USD

Useful links:

My other articles are available in this section

InstaForex course for beginners

Popular Analytics

Open trading account

Important:

The begginers in forex trading need to be very careful when making decisions about entering the market. Before the release of important reports, it is best to stay out of the market to avoid being caught in sharp market fluctuations due to increased volatility. If you decide to trade during the news release, then always place stop orders to minimize losses.

Without placing stop orders, you can very quickly lose your entire deposit, especially if you do not use money management and trade large volumes. For successful trading, you need to have a clear trading plan and stay focues and disciplined. Spontaneous trading decision based on the current market situation is an inherently losing strategy for a scalper or daytrader.

#instaforex #analysis #sebastianseliga Pentru mai multe detalii, va invitam sa vizitati stirea originala.

Trading plan for EUR/USD on August 6. Simple tips for beginners

Back
Trading plan


Back
Trading plan


Trading plan for EUR/USD on August 6. Simple tips for beginners


Analyzing Monday's trades:EUR/USD on 1H chart


The premium article will be available in
00:00:00

06.08.2024 07:20 AM


The premium article will be available in00:00:00

06.08.2024 07:20 AM


Analyzing Monday's trades:EUR/USD on 1H chart The EUR/USD pair showed high volatility again on Monday. This time, the dollar's problem was complex. The greenback depreciated further, although it collapsed on Friday following the latest disappointing reports on the U.S. labor market and unemployment. However, over the weekend, information began to emerge that the Federal Reserve might not only cut the key rate several times in 2024 due to a high likelihood of a recession but also hold


Fresh articles are available only to premium users


Read analytics in early access, getting information first
Get

Pentru mai multe detalii, va invitam sa vizitati stirea originala.

Forecast for EUR/USD on August 6, 2024

EUR/USD

Yesterday's market panic had almost subsided by this morning. Monday did not turn out to be a "black" day. The S&P 500 plummeted by 4.71%, closing at -3.00%. Good ISM figures supported the market: business activity in the non-manufacturing sector strengthened from 49.6 to 54.5 in July, and the employment index rose from 46.1 to 51.1 against an expectation of 46.4. However, the cunning euro buyers we mentioned in our last review chose a bad moment for their action. Market participants did not believe in their notions of a fourfold rate cut by the end of the year, specifically a double decrease of 0.5% each. We saw a similar pattern last November when investors anticipated a sixfold rate cut for the current year, but then the euro fell by 4.5 figures.

After reaching the target level of 1.1010, the price is now ready to form a divergence with the Marlin oscillator on the daily chart. If the pair closes the day below the July 17th peak of 1.0949, the likelihood of the price returning to 1.0905 and attempting to consolidate below this level will significantly increase.

The target level of 1.1018, which we highlighted on the weekly chart, no longer needs to be met with absolute precision unless it is to continue the rise above 1.12.

The price is consolidating below the resistance at 1.0964 in the 4-hour chart. Marlin is striving to exit the overbought zone. If the price consolidates below the level of 1.0905 in this time frame, it will also mean settling below the MACD line on the weekly chart. We're waiting for the market to cool down and form more stable signs of reversal and decline.

Pentru mai multe detalii, va invitam sa vizitati stirea originala.

Forecast for USD/JPY on August 6, 2024

#

USD/JPY

The USD/JPY pair has been falling for five weeks. The Marlin oscillator is starting to turn upwards, but the price can still reach the target level of 140.27, which is the low from last December and nearly coincides with the 61.8% corrective level.

analytics66b19262afc58.jpg

On the daily chart, the price bounced after dropping 480 pips. The pair closed the day down by 233 pips. Today, the price's upper shadow reached the target resistance of 146.50, thus completing the range of yesterday's movement.

analytics66b1927abda97.jpg

Now, the price can leisurely proceed to 140.26, from where it will enter a correction, likely back to the range of 144.30-145.08. The Marlin oscillator is in oversold territory.

analytics66b192876436c.jpg

On the 4-hour chart, the Marlin oscillator has come out of the oversold zone. The price is settling in the range of 144.30-145.08, after which it may resume the decline. We're waiting for the price at the target level of 140.27, followed by a corrective return to the range, to meet the Marlin oscillator.

The material has been provided by InstaForex Company - www.instaforex.com #

Trading recommendations and analysis for EUR/USD on August 6; The markets are panicking, the euro rose to the 1.10 level

#

Analysis of EUR/USD 5M

analytics66b168bed91fd.jpg

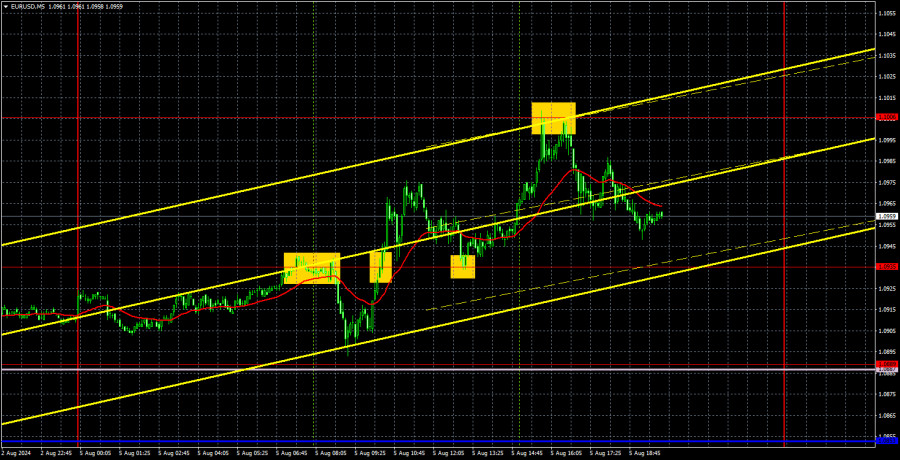
On Monday, the EUR/USD pair showed relatively high volatility and sustained its growth, which began on Friday. At first glance, it was unclear what caused the new bullish momentum. On second glance, it was still not entirely clear. However, a bit later, it became evident that many markets experienced a "black day" on Monday. The cryptocurrency market, the U.S. stock market, and many stock markets worldwide closed in record "losses." Therefore, the increased volatility in the currency market results from the same events.

The events are quite simple but not obvious. Over the weekend, rumors emerged that the Federal Reserve might lower the key rate by 0.5% in September and conduct 2 or 3 such "extreme" easings by the end of the year. Many experts began to proclaim at every corner that a recession for the American economy was inevitable, and the Fed should urgently save the situation. It is hard to say how much this information corresponds to real affairs. However, rumors even began to appear in the market about an emergency Fed meeting to be held before September to decide on easing monetary policy.

If these rumors continue circulating in the market, the U.S. dollar may continue its free fall. Admit that if Friday's reports had not been disastrous again, the pair's current rise would not have happened. There wouldn't have been a panic in the markets. Therefore, technical analysis is irrelevant here. Four trading signals were formed on Monday, two duplicating each other. Only the second and fourth signals were profitable, but due to good volatility, the profit was decent.

COT report:

analytics66b168d266e50.jpg

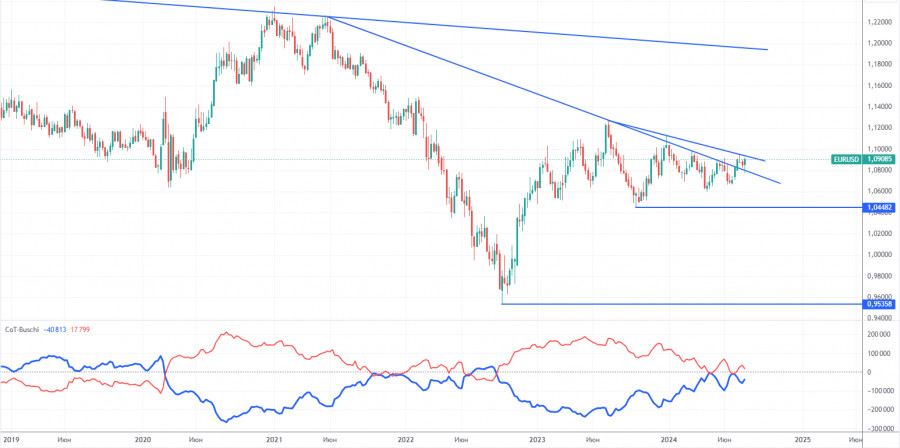
The latest COT report is dated July 30. The illustration above shows that the net position of non-commercial traders has been bullish for a long time and remains so at this time. The bears' attempt to move into their zone of dominance failed miserably. The net position of non-commercial traders (red line) has declined in recent months, while that of commercial traders (blue line) has grown. They are roughly equal at this time, suggesting a new attempt by the bears to retake the lead.

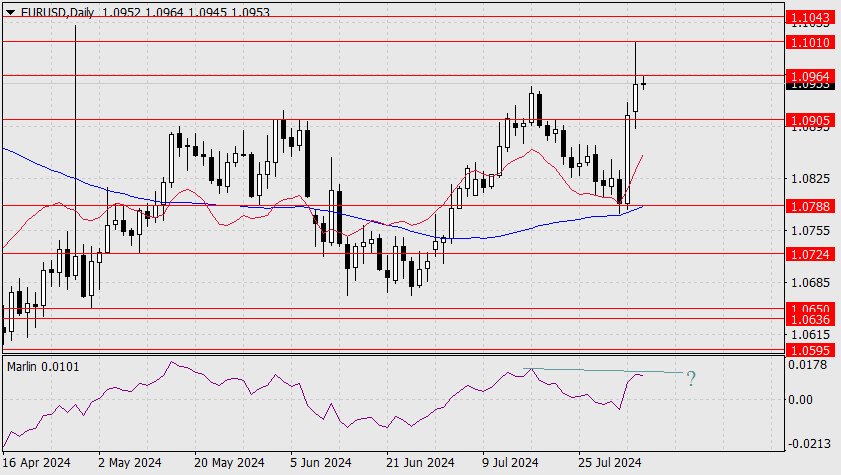
We also still do not see any fundamental factors allowing the euro to gain significant momentum, and the technical analysis tells us that the price is in the consolidation zone—in other words, in a flat range. The general downtrend in the euro remains, but the market decided to take a break for six months.

At the moment, the red and blue lines are slightly moving away from each other, which indicates that long positions on the single currency are increasing. However, given the flat conditions, such changes cannot be the basis for long-term conclusions. During the last reporting week, the number of longs in the non-commercial group decreased by 5,900, while the number of shorts increased by 12,100. Accordingly, the net position decreased by 18,000. According to COT reports, the euro still has the potential for decline.

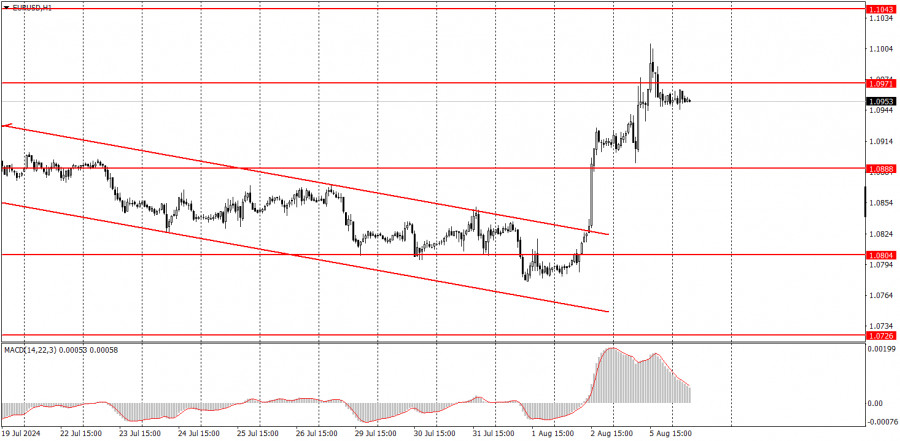
Analysis of EUR/USD 1H

analytics66b168dab7f32.jpg

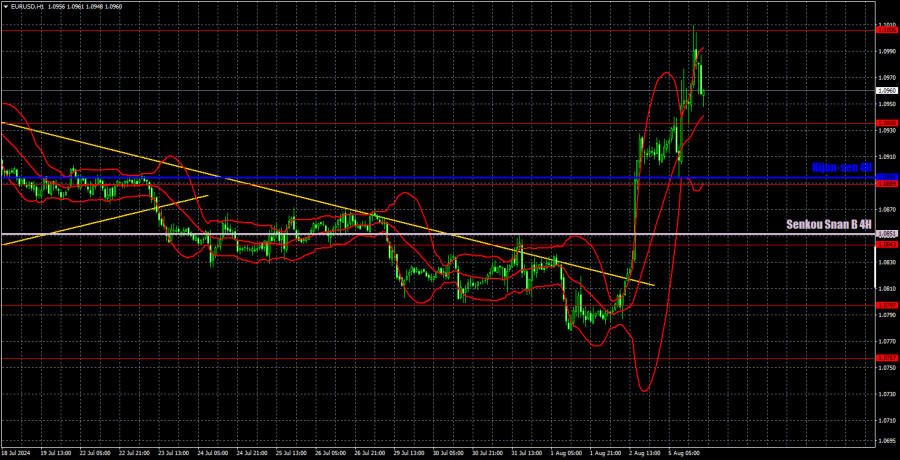
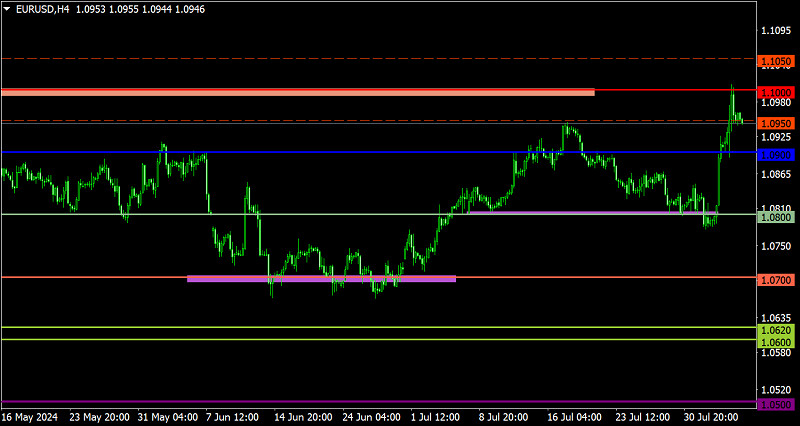
In the hourly time frame, EUR/USD again showed a sharp and strong growth, but, from our perspective, it does not offer "great prospects" for the euro. Panic prevailed in the markets on Friday and Monday, yet the euro remains within the same horizontal channel of 1.0600-1.1000, as it has for the past seven months. We believe there is a high likelihood of a new bounce from the 1.1000 level unless the Federal Reserve holds an emergency meeting this week.

For August 6, we highlight the following levels for trading: 1.0530, 1.0581, 1.0658-1.0669, 1.0757, 1.0797, 1.0843, 1.0889, 1.0935, 1.1006, 1.1092, as well as the Senkou Span B (1.0851) and Kijun-sen (1.0894) lines. The Ichimoku indicator lines can move during the day, so this should be considered when identifying trading signals. Remember to set a Stop Loss to break even if the price has moved in the intended direction by 15 pips. This will protect you against potential losses if the signal turns out to be false.

The only relatively important event on Tuesday will be the Eurozone retail sales report. But who is concerned about this report now? The market will look for new signals about a possible emergency easing Fed policy and closely monitor other markets tomorrow. The state of panic may persist, and panic always results in chaotic movements.

Explanation of illustrations:

Support and resistance levels: Thick red lines near which the trend may end.

Kijun-sen and Senkou Span B lines: These Ichimoku indicator lines, transferred from the 4-hour timeframe to the hourly chart, are strong lines.

Extreme levels: Thin red lines from which the price previously bounced. These provide trading signals.

Yellow lines: Trend lines, trend channels, and other technical patterns.

Indicator 1 on COT charts: The net position size for each category of traders

The material has been provided by InstaForex Company - www.instaforex.com #

GBP/USD: simple trading tips for beginners for the European session on August 5

Back
Forecast


Back
Forecast


GBP/USD: simple trading tips for beginners for the European session on August 5


Analysis of trades and tips on


The premium article will be available in
00:00:00

05.08.2024 09:49 AM


The premium article will be available in00:00:00

05.08.2024 09:49 AM


Analysis of trades and tips on on GBP/USDThe price test of 1.2760 occurred when the MACD indicator had significantly risen from the zero mark. However, I focused on acting in the second half of the day, ignoring the indicator's readings. As expected, the pair showed strong and decisive movements after the U.S. data. As a result of purchases, GBP/USD rose by more than 50 pips. Last Friday, the speech by Bank of England MPC member Huw Pill went unnoticed, which


Fresh articles are available only to premium users


Read analytics in early access, getting information first
Get

Pentru mai multe detalii, va invitam sa vizitati stirea originala.

EUR/USD. Preview of the week: calm after the storm

The premium article will be available in00:00:00

05.08.2024 06:58 AM


"It's either feast or famine" is how one could describe the schedule of the most important macroeconomic releases for the EUR/USD pair. The economic calendar of the previous week was overloaded with significant events. Reports on eurozone inflation, euro area GDP, the ISM manufacturing index, Nonfarm Payrolls, and the Federal Reserve's July meeting... Such a concentration of important fundamental factors can sometimes be confusing: the market may not have time to digest the information, formulate a unified opinion, and decide


Fresh articles are available only to premium users


Read analytics in early access, getting information first
Get

Pentru mai multe detalii, va invitam sa vizitati stirea originala.

Technical Analysis of Intraday Price Movement of GBP/USD Main Currency Pairs, Monday August 05, 2024.

If we look at the 4-hour chart, the main currency pair GBP/USD looks weak where from the technical analysis side we find that the price movement is moving below the EMA 20 & EMA 50 where the position of the EMA 20 is below the EMA 50 which indicates that the Cable condition is under pressure. This is also confirmed by the appearance of hidden deviations between the GBP/USD price movement which makes a Higher Low while the MACD Histogram indicator actually forms a Higher High so that based on all this information in the near future GBP/USD has the potential to weaken down where the level of 1.2721 will be tested again by Cable if this level is successfully broken below then GBP/USD will go to the level of 1.2639 and if volatility and momentum support then GBP/USD will go to the level of 1.2589 but please note that the emergence of the failing Wedge pattern has the potential to bring GBP/USD to strengthen upward correction especially if it breaks above the level of 1.2853 then all the weakening scenarios that have been described previously will be invalid and automatically canceled by themselves.

(Disclaimer)

Pentru mai multe detalii, va invitam sa vizitati stirea originala.