The dollar is off to a false start

#

As U.S. inflation has slowed for several consecutive months and unemployment has risen, the market has started demanding almost three federal funds rate cuts from the Federal Reserve, more than the latest FOMC forecast. Investors expect signals from Fed Chair Jerome Powell and his colleagues in July about the start of monetary easing in September. However, reality may be different.

Reflecting on the past, the market was demanding six to seven rate cuts from the Fed at the start of the year. However, as consumer prices accelerated, they were willing to settle for one act of monetary easing. The U.S. dollar rose only to weaken by the end of the year. But history risks repeating itself. The consensus forecast of Reuters experts suggests that by the end of 2024, the Fed and the Bank of England will cut borrowing costs twice, and the ECB will do so three times. 56% of respondents believe that inflation will be higher than currently expected.

European inflation dynamics

analytics66a78d666bbeb.jpg

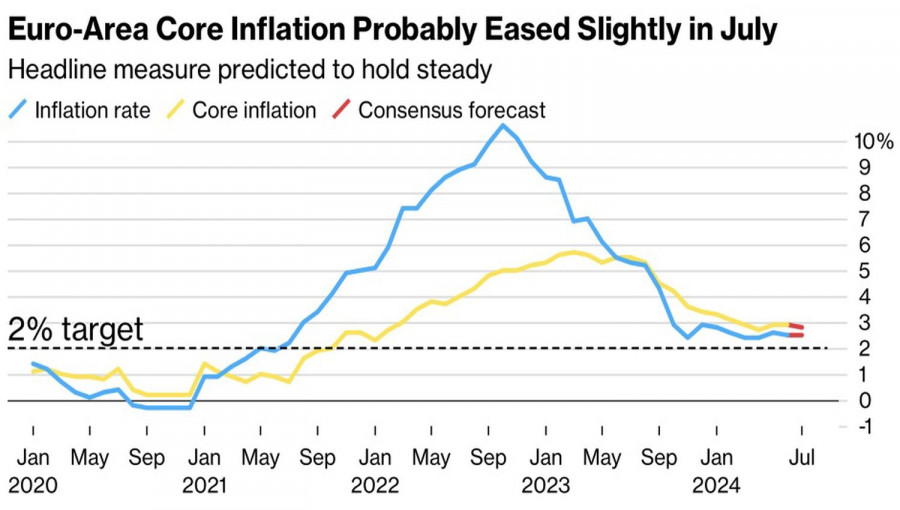
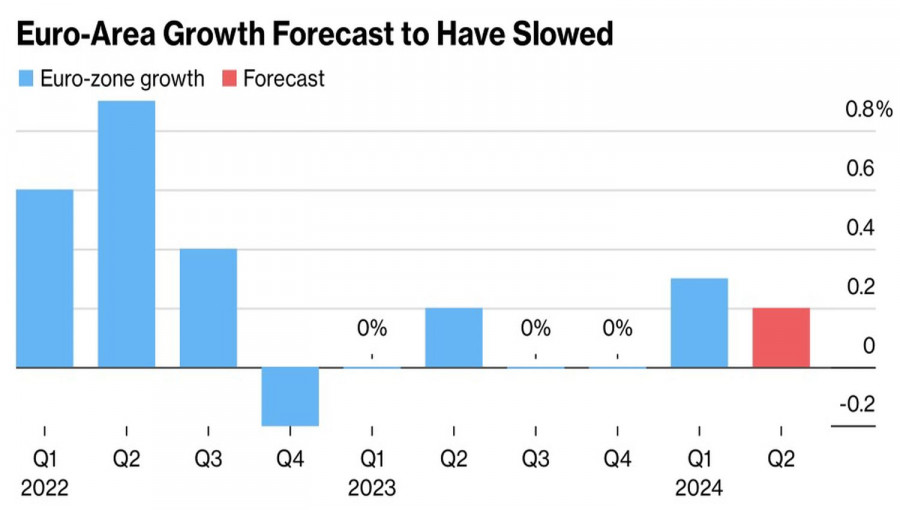
People often mistake their desires for reality. Markets are no exception. The decline of EUR/USD is driven by expectations of a slowdown in the European CPI from 2.5% to 2.4% and core inflation from 2.9% to 2.8% year-over-year in July. Simultaneously, GDP growth rates are forecasted to drop from 0.3% to 0.2% quarter-over-quarter. If this happens, it will push the European Central Bank to lower its rates at one of its upcoming meetings. This is unsurprising, as the Governing Council's decisions depend on data.

The U.S. presidential race is also putting significant pressure on the regional currency. The leading candidate, Donald Trump, has pledged to increase tariffs on imports from China to 60% and from other countries to 10%. If these policies are enacted, they could disrupt global supply chains and potentially slow down the global economy. This is particularly concerning for pro-cyclical currencies like the euro and the pound.

European economic dynamics

analytics66a78d73acf93.jpg

At the same time, the fall of EUR/USD ahead of important data looks like a trap set by major players. In reality, signals from the Fed about lowering rates in September and a further slowdown in the U.S. labor market are more detrimental to the main currency pair than the cooling of European inflation and GDP. As for Donald Trump, he has not yet won, so it is too early to talk about a renewed trade war or currency interventions.

analytics66a78d7e51859.jpg

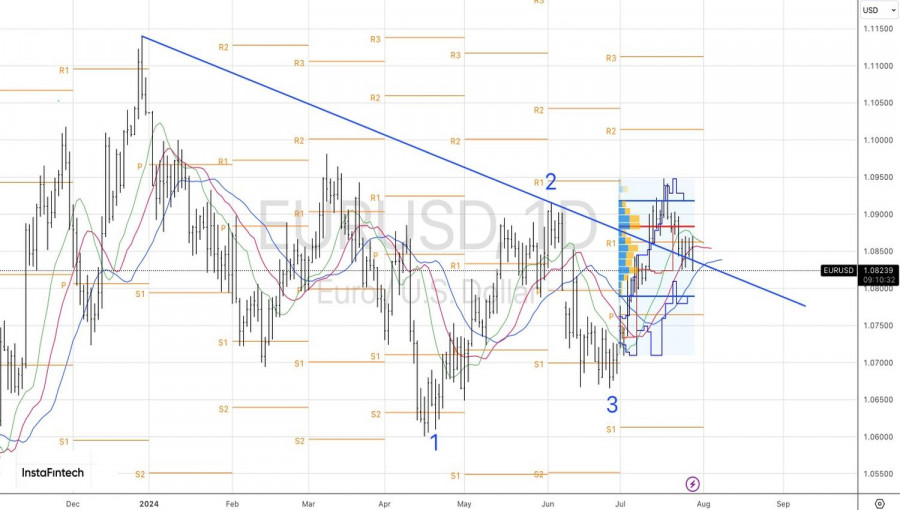
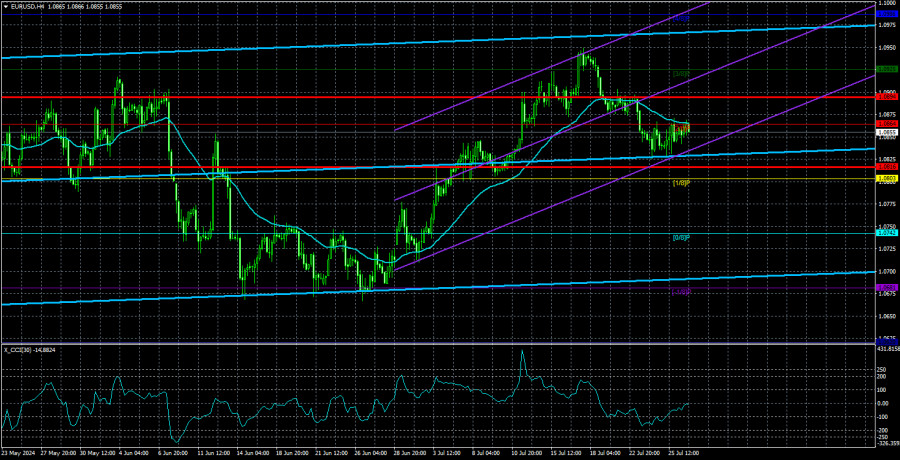
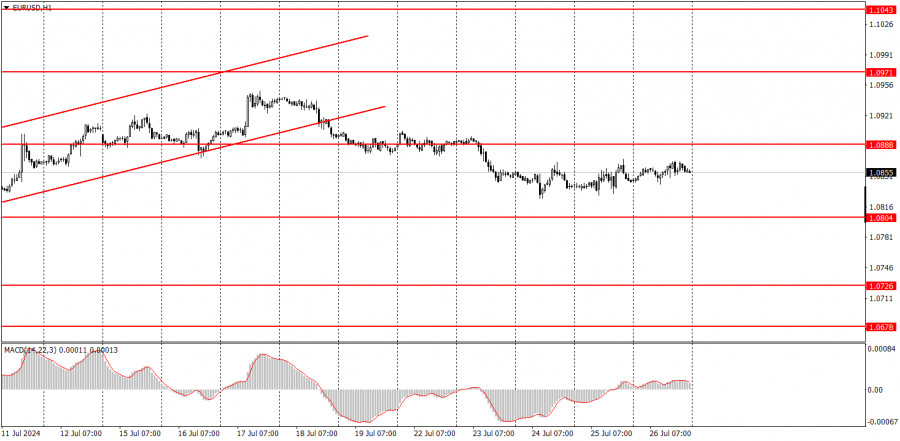
As mentioned earlier, the 1.083 level is a red line for EUR/USD. Falling below it increases the risks of continued decline; however, everything will depend on the events of the week leading up to August 2. The breach of support may be a false start.

Technically, on the daily chart, EUR/USD has moved outside the short-term consolidation range between 1.083 and 1.087. A return to its midpoint near 1.085 activates the Fake-out pattern and becomes a basis for buying. Similarly, a rebound from the lower boundary of the fair value range and the pivot level at 1.080 could also be a signal for long positions.

The material has been provided by InstaForex Company - www.instaforex.com #

USDJPY: Simple Trading Tips for Beginner Traders on July 29 (U.S. Session)

Analysis of Trades and Tips for Trading the Japanese Yen

The test of the price at 153.29 coincided with the beginning of the MACD indicator's downward movement from the zero mark, confirming the correct entry point for selling the dollar along the trend. However, the market reversed after moving down by 10 points, leading to a stop loss. Purchases at 153.75 were not opened, as the MACD indicator had already moved significantly upward and was far from the zero mark when updating the level. Trading will remain within the channel in the second half of the day, as there are no reports from the U.S. that could lead to a spike in USD/JPY volatility. However, it is better to focus on selling the dollar, as the Federal Reserve might lower rates this Wednesday, and the Bank of Japan might raise theirs. Regarding the intraday strategy, I plan to act based on the implementation of scenarios #1 and #2.

Buy Signal

Scenario #1: Today, I plan to buy USD/JPY upon reaching the entry point around 153.96 (green line on the chart), with a target of rising to 154.46 (thicker green line). Around 154.46, I will exit the purchases and open sales in the opposite direction (expecting a move of 30-35 points in the opposite direction from the level). It is unlikely that the pair will see a strong rise today, so it is better to look for purchases as low as possible. Important! Before buying, ensure the MACD indicator is above the zero mark and starting to rise.

Scenario #2: I also plan to buy USD/JPY today in case of two consecutive tests of the price at 153.55 when the MACD indicator is in the oversold area. This will limit the pair's downward potential and lead to an upward market reversal. Expect growth to the opposite levels of 153.96 and 154.46.

Sell Signal

Scenario #1: Today, I plan to sell USD/JPY after updating the level of 153.55 (red line on the chart), leading to a quick decline in the pair. The key target for sellers will be the level of 153.04, where I will exit the sales and immediately open purchases in the opposite direction (expecting a move of 20-25 points in the opposite direction from the level). Pressure on the pair will return in case of an unsuccessful attempt to break above 153.96. Important! Before selling, ensure the MACD indicator is below the zero mark and starting to fall from it.

Scenario #2: I also plan to sell USD/JPY today in case of two consecutive tests of the price at 153.96 when the MACD indicator is in the overbought area. This will limit the pair's upward potential and lead to a market reversal downward. Expect a decline to the opposite levels of 153.55 and 153.04.

What the Chart Shows:

Thin green line: Entry price at which you can buy the trading instrument.Thick green line: Estimated price where you can set Take Profit or manually lock in profits, as further growth above this level is unlikely.Thin red line: Entry price at which you can sell the trading instrument.Thick red line: Estimated price where you can set Take Profit or manually lock in profits, as further decline below this level is unlikely.MACD Indicator: When entering the market, it is important to consider overbought and oversold areas.

Important: Beginner traders in the forex market must make entry decisions cautiously. Before releasing important fundamental reports, staying out of the market is best to avoid sharp exchange rate fluctuations. If you decide to trade during news releases, always set stop orders to minimize losses. Without stop orders, you can quickly lose your entire deposit, especially if you do not use money management and trade large volumes.

Remember that successful trading requires having a clear trading plan, like the one I presented above. Making spontaneous trading decisions based on the current market situation is initially a losing strategy for an intraday trader.Pentru mai multe detalii, va invitam sa vizitati stirea originala.

Forecast for GBP/USD on July 29, 2024

GBP/USD

The British pound is slightly rising from the support level at 1.2847. The Marlin oscillator hovers around the zero line, indicating sideways movement. Traditionally, to confirm the direction of the trend, traders need to wait for the price to settle below a certain level. However, with the FOMC meeting approaching, the pair may immediately breach the support at 1.2847. The target is 1.2755, and the MACD line is approaching it.

A breach of this level, along with the MACD line, will be a final sign that the market has chosen a downward direction. Conversely, overcoming the resistance at 1.2989—which corresponds to the support from March-April 2022 and the resistance from July 2023—will be a sign of medium-term growth.

On the 4-hour chart, the price is consolidating above the support level of 1.2847. The Marlin oscillator is starting to move sideways along the neutral zero line. The price shows progress below the balance line, which indicates a bearish bias. In addition, the MACD line has turned downward, showing a short-term bearish trend.

Pentru mai multe detalii, va invitam sa vizitati stirea originala.

Forecast for USD/JPY on July 29, 2024

USD/JPY

On Thursday and Friday, the yen experienced high volatility, but both days closed less than 20 pips above the support level of 153.60. This was a form of consolidation above the level.

This morning, the price has unexpectedly dropped below this level, and it needs to close the day below it to technically "open" the target range of 150.83-151.23. If the pair does not start a correction from this support, it will continue to move towards the next target at 148.82. At that point, the Marlin oscillator will already be in the oversold zone.

On the 4-hour chart, the price is already aiming to settle below the 153.60 level. The Marlin oscillator is turning down after easing from the oversold area and is ready for a new wave of decline. The balance and MACD indicator lines are moving downward. At the moment, the trend appears to be stable. We expect the price to reach the first target range of 150.83-151.23.

Pentru mai multe detalii, va invitam sa vizitati stirea originala.

Overview of GBP/USD. Preview of the week: NonFarm Payrolls and Unemployment in the US will not affect anything

#

analytics66a5d7883760a.jpg

GBP/USD moved by 29 pips on Friday. In general, there is nothing more to analyze as there were no movements in the market. Over the past two weeks, the British currency has slightly corrected lower, but we still doubt that this slight drop is the start of a trend even within the 4-hour time frame. The pound has signaled the end of the upward trend numerous times in the past few months, and each time, the growth resumed with almost no decline. The market shows it is ready to buy the British currency regardless of circumstances. COT reports indicate a massive dominance of bulls. Macroeconomic data (irrespective of their nature) only lead to the pair's growth. Market participants are not interested in the fundamental background. Moreover, market volatility is low.

Therefore, all the major events of the coming week are significant only formally. We have already mentioned that even from the Federal Reserve meeting, nothing substantial should be expected. Fed Chair Jerome Powell is unlikely to hint at a rate cut, and the FOMC committee will unlikely make important decisions to adjust this policy. This is because inflation in the US is still far from the target level, so there are no grounds for a rate cut soon. Moreover, the latest US GDP report showed that the American economy is doing well, providing the central bank additional time. Now, the Fed has no reason to rush.

Apart from the Fed meeting, the US will publish reports on unemployment, the labor market, ISM business activity indices, and JOLTs and ADP reports. Of course, these are very important data, but again, considering the volatility, we understand that strong movements should not be expected. Positive US data may be overlooked, while negative data could prompt a response. We do not even see the point in speculating about what the actual values of the aforementioned reports will be.

The Bank of England meeting will take place in the UK, which is essentially the week's key event. The BoE may begin to lower its rates as inflation allows it to do so. If we are correct, the BoE will follow the European Central Bank, and the Fed's rate will remain at its peak for a long time. If the market does not start actively buying the dollar even after this, it will only confirm the complete illogicality of the current movements of the GBP/USD pair. In principle, even official forecasts predict a rate cut on August 1. This is not just our opinion. And no matter how much the British central bank tries to convince the market that something has yet to be decided and that inflation in the services sector is too high, the main indicator is the core Consumer Price Index, not the CPI in specific sectors. Thus, we believe that the BoE will also start easing monetary policy, but whether the British pound will start depreciating is a big question.

analytics66a5d796e1c13.jpg

The average volatility of the GBP/USD pair over the last five trading days is 43 pips. This is considered a low value for the pound/dollar pair. On Monday, July 29, we expect movement within the range limited by 1.2821 and 1.2907. The higher linear regression channel is directed upwards, signaling the continuation of the upward trend. The CCI indicator has entered the overbought area twice, signaling a potential decline. In addition, there is a divergence between the last two price peaks and the indicator.

Nearest Support Levels:

  • S1 – 1.2848
  • S2 – 1.2817
  • S3 – 1.2787

Nearest Resistance Levels:

  • R1 – 1.2878
  • R2 – 1.2909
  • R3 – 1.2939

Trading Recommendations:

The GBP/USD pair has finally settled below the moving average line and has a real chance for a significant decline. Volatility remains low, but short positions are currently valid, with initial targets at 1.2878 and 1.2848. A bullish correction might occur, after which the decline is expected to resume. We are not considering long positions at the moment, as all the bullish factors for the British currency (which are not much) have already been factored in by the market multiple times. Even if the pound shows a new upward movement, it will not add logic to such a movement.

Explanations for Illustrations:

Linear Regression Channels – help determine the current trend. If both are directed in the same direction, it means the trend is strong.

Moving Average Line (settings 20,0, smoothed) – determines the short-term trend and the direction in which trading should be conducted.

Murray Levels – target levels for movements and corrections.

Volatility Levels (red lines) – the probable price channel in which the pair will spend the next 24 hours, based on current volatility indicators.

CCI Indicator: Entering the oversold area (below 250) or the overbought area (above +250) means a trend reversal is approaching.

The material has been provided by InstaForex Company - www.instaforex.com #

Technical Analysis of Intraday Price Movement of Cardano Cryptocurrency, Friday July 26, 2024.

Back
Crypto-currencies


Back
Crypto-currencies


Technical Analysis of Intraday Price Movement of Cardano Cryptocurrency, Friday July 26, 2024.


Although on the 4-hour chart, the


The premium article will be available in
00:00:00

29.07.2024 04:14 AM


The premium article will be available in00:00:00

29.07.2024 04:14 AM


Although on the 4-hour chart, the Cardano cryptocurrency is still
dominated by Sellers, which is indicated by the price movement of the
cryptocurrency moving within the Bearish Pitchfork channel, but with the
occurrence of a deviation between the price movement and the MACD
Histogram indicator, it gives an indication that in the near future
Cardano will experience a strengthening correction, but as long as the
strengthening correction is not more than 0.41480, Cardano actually
still has the potential to continue


Fresh articles are available only to premium users


Read analytics in early access, getting information first
Get

Pentru mai multe detalii, va invitam sa vizitati stirea originala.

Technical Analysis of Intraday Price Movement of Solana Cryptocurrency, Friday July 26, 2024.

Back
Crypto-currencies


Back
Crypto-currencies


Technical Analysis of Intraday Price Movement of Solana Cryptocurrency, Friday July 26, 2024.


If we look at the 4-hour


The premium article will be available in
00:00:00

29.07.2024 04:14 AM


The premium article will be available in00:00:00

29.07.2024 04:14 AM


If we look at the 4-hour chart, the Solana cryptocurrency seems to still be moving in a strengthening condition even though there is currently a weakening correction but is stuck at the Bullish Fair Value Gap level which functions as a significant support level, so in the near future as long as there is no weakening that breaks below the 162.50 level, Solana will strengthen again where this has also been confirmed by the appearance of hidden deviations and the


Fresh articles are available only to premium users


Read analytics in early access, getting information first
Get

Pentru mai multe detalii, va invitam sa vizitati stirea originala.

Overview of EUR/USD. Preview of the week: The Fed meeting and Eurozone inflation

Back
Fundamental analysis


Back
Fundamental analysis


Overview of EUR/USD. Preview of the week: The Fed meeting and Eurozone inflation


EUR/USD once again showed ultra-low volatility


The premium article will be available in
00:00:00

29.07.2024 03:48 AM


The premium article will be available in00:00:00

29.07.2024 03:48 AM


EUR/USD once again showed ultra-low volatility on Friday. The pair was practically immobilized despite at least three reports published during the US trading session that could have served as drivers. However, this did not happen. Recall that the US released important data a day earlier, even more significant than on Friday. In particular, the GDP data for the second quarter and durable goods orders were released. Both reports were highly impactful. GDP grew much stronger than expected, while orders plummeted


Fresh articles are available only to premium users


Read analytics in early access, getting information first
Get

Pentru mai multe detalii, va invitam sa vizitati stirea originala.

Trading plan for GBP/USD on July 29. Simple tips for beginners

#

Analyzing Friday's trades:

GBP/USD on 1H chart

analytics66a52a99072f3.jpg

On Friday, GBP/USD continued to trade with low volatility. We saw a somewhat decent movement on Thursday, but such "disorder" didn't last long. Strangely, the British pound reacted with a decline on Thursday to the stellar GDP report from the US for the second quarter. Overall, the British currency continues to fall as it should, based on almost all types of analysis. However, the market has been reluctant to sell the pair over the past six months, so this time, the fall of the British pound may be short-lived, regardless of the fundamentals and macroeconomics.

On Friday, the US dollar could have strengthened further as the PCE index exceeded monthly and annual forecasts. This means that inflation in the US may accelerate slightly again, practically nullifying the possibility of a Federal Reserve rate cut in September. In addition, the consumer sentiment index from the University of Michigan exceeded market expectations. However, the market deemed it was excessive to work off positive US data with dollar purchases for two consecutive days.

GBP/USD on 5M chart

analytics66a52aa30eaa4.jpg

In the 5-minute time frame on Friday, the pound sterling bounced several times from the 1.2848-1.2860 area, but the entire movement was flat. Therefore, we don't even consider these bounces as signals. Novice traders could have opened a long position, which they could even close without losses, but trading in a low-volatility flat made no sense.

Trading tips on Monday:

In the hourly time frame, GBP/USD finally has a chance of a minor decline. The pair has breached the ascending trendline, so we might see some correction. Ideally, the pound should drop by at least 400-500 pips. The market has processed all the bullish factors about three times, the dollar is undervalued, and the Bank of England may start lowering its rates as early as next week. The British currency has more reasons to fall than to rise.

On Monday, novice traders may trade within the range of 1.2848-1.2860, but there is a high probability that market volatility will be very low again.

The key levels to consider on the 5M timeframe are 1.2605-1.2633, 1.2684-1.2693, 1.2748, 1.2791-1.2798, 1.2848-1.2860, 1.2913, 1.2980-1.2993, 1.3043, 1.3102-1.3107, and 1.3145. On Monday, no significant events are planned in the UK and the US. Later in the week, many important events will occur, but they do not guarantee a trend and a strong market reaction.

Basic rules of a trading system:

1) The strength of a signal is determined by the time it took for the signal to form (bounce or level breakthrough). The shorter the time required, the stronger the signal.

2) If two or more trades around a certain level are initiated based on false signals, subsequent signals from that level should be ignored.

3) In a flat market, any currency pair can produce multiple false signals or none at all. In any case, it's better to stop trading at the first signs of a flat market.

4) Trades should be opened between the start of the European session and mid-way through the U.S. session. All trades must be closed manually after this period.

5) In the hourly time frame, trades based on MACD signals are only advisable amidst substantial volatility and an established trend, confirmed either by a trendline or trend channel.

6) If two levels are too close to each other (from 5 to 20 pips), they should be considered as a support or resistance zone.

7) After moving 15 pips in the intended direction, the Stop Loss should be set to break-even.

What the charts show:

Support and Resistance price levels can serve as targets when buying or selling. You can place Take Profit levels near them.

Red lines represent channels or trend lines that depict the current trend and indicate the preferred trading direction.

The MACD (14,22,3) indicator, encompassing both the histogram and signal line, acts as an auxiliary tool and can also be used as a source of signals.

Important speeches and reports (always noted in the news calendar) can profoundly influence the price dynamics. Hence, trading during their release calls for heightened caution. It may be reasonable to exit the market to prevent abrupt price reversals against the prevailing trend.

Beginners should always remember that not every trade will yield profit. Establishing a clear strategy, coupled with effective money management, is key to long-term success in trading.

The material has been provided by InstaForex Company - www.instaforex.com #

Trading plan for EUR/USD on July 29. Simple tips for beginners

#

Analyzing Friday's trades:

EUR/USD on 1H chart

analytics66a52026c387e.jpg

EUR/USD continued to pretend to trade on Friday. Volatility was again low, so we generally didn't see any movement throughout the day. Once again, novice traders could see that market activity (also known as volatility) is one of the most critical indicators. On Thursday, two important reports were published in the US – GDP and durable goods orders. And what happened? There were still no movements. On Friday, data on personal income and spending of the American population, the PCE index, and the consumer sentiment index were published in the US. What happened? There were still no movements. And we are already silent about the fact that the dollar had an excellent opportunity to appreciate on Thursday and Friday, as GDP grew much more substantial than expected, and the PCE index was higher than forecasts. A high GDP indicates that the Federal Reserve can continue to keep the rate at its peak value, and a high PCE suggests that inflation in the US may accelerate again.

EUR/USD on 5M chart

analytics66a5203a0f027.jpg

It doesn't make sense to highlight trading signals in the 5-minute timeframe for the second day. The price was around the 1.0838-1.0856 area almost all day, but can we say it broke through or bounced off it? We observed total flat movement with low volatility. Even economic reports did not influence traders' desire to trade. Therefore, there was no sense in considering market signals.

Trading tips on Monday:

In the hourly time frame, EUR/USD settled below the ascending channel, allowing it to start a new local downward trend. We believe the euro has fully factored in all the bullish factors, so a significant correction is needed. However, the nature of the movements is best seen in the 24-hour timeframe. It is the same flat range between 1.0600 and 1.1000. Volatility remains low, and the market has generally stopped reacting to macro data and events.

On Monday, novice traders may try to trade from the 1.0838-1.0856 area again, but it is possible that the pair's movement will be similar to Thursday and Friday, making looking for entry points into the market pointless.

The key levels to consider on the 5M timeframe are 1.0526, 1.0568, 1.0611, 1.0678, 1.0726-1.0733, 1.0797-1.0804, 1.0838-1.0856, 1.0888-1.0896, 1.0940, and 1.0971-1.0981. No important events or reports are scheduled for Monday in the Eurozone or the US. The likelihood of witnessing low volatility again is very high.

Basic rules of a trading system:

1) The strength of a signal is determined by the time it took for the signal to form (bounce or level breakthrough). The shorter the time required, the stronger the signal.

2) If two or more trades around a certain level are initiated based on false signals, subsequent signals from that level should be ignored.

3) In a flat market, any currency pair can produce multiple false signals or none at all. In any case, it's better to stop trading at the first signs of a flat market.

4) Trades should be opened between the start of the European session and mid-way through the U.S. session. All trades must be closed manually after this period.

5) In the hourly time frame, trades based on MACD signals are only advisable amidst substantial volatility and an established trend, confirmed either by a trendline or trend channel.

6) If two levels are too close to each other (from 5 to 20 pips), they should be considered as a support or resistance zone.

7) After moving 15 pips in the intended direction, the Stop Loss should be set to break-even.

What the charts show:

Support and Resistance price levels can serve as targets when buying or selling. You can place Take Profit levels near them.

Red lines represent channels or trend lines that depict the current trend and indicate the preferred trading direction.

The MACD (14,22,3) indicator, encompassing both the histogram and signal line, acts as an auxiliary tool and can also be used as a source of signals.

Important speeches and reports (always noted in the news calendar) can profoundly influence the price dynamics. Hence, trading during their release calls for heightened caution. It may be reasonable to exit the market to prevent abrupt price reversals against the prevailing trend.

Beginners should always remember that not every trade will yield profit. Establishing a clear strategy, coupled with effective money management, is key to long-term success in trading.

The material has been provided by InstaForex Company - www.instaforex.com #