Trading plan for EUR/USD on August 2. Simple tips for beginners
EUR/USD on 1H chart
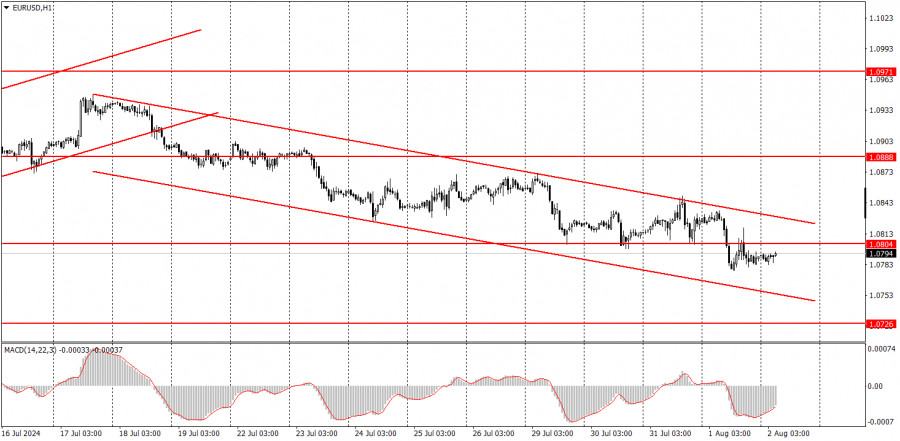
The EUR/USD pair sustained its mild decline on Thursday. A descending channel has formed in the hourly time frame, indicating not so much the direction of movement (already evident) but rather the stability of the downward trend. This week, news was about a possible cut in the Federal Reserve's key interest rate in September. The probability of this is not 100%, but it does represent an increase in dovish rhetoric from Federal Reserve Chair Jerome Powell. Nevertheless, the U.S. dollar continued to rise gradually and steadily. Therefore, we conclude that the main focus now is on the horizontal channel in the 24-hour time frame, which suggests a decline toward the 1.0600-1.0650 range. Initially, the euro rose for several weeks despite the fundamentals and macroeconomics; now, the dollar might exhibit a similar movement.
It is also worth noting that the U.S. ISM Manufacturing Index was published yesterday. It was much weaker than forecasts, which did not derail the market's downward trajectory. Once again, we highlight that the key factor is the market sentiment, and news can be interpreted in various ways or used for corrections.
EUR/USD on 5M chart
Three trading signals were generated in the 5-minute time frame on Thursday. At the start of the European trading session, the price bounced off the 1.0838 level, fell by about 50 pips, and stabilized below the 1.0797-1.0804 range. However, this movement ended there. During the U.S. session, the dollar was under pressure due to the same ISM index, making it impractical to remain in short positions. Shorts should have been closed below the 1.0797-1.0804 area before or after the ISM release.
Trading tips on Friday:
In the hourly time frame, EUR/USD continues its downward movement. We believe the euro has fully factored in all the bullish factors, so a significant correction is needed. However, the nature of the movements is best seen in the 24-hour timeframe. In general, this is a range-bound market between 1.0600 and 1.1000. Volatility remains low, and the market has stopped reacting to macro data and events, or interprets them in its own way.
On Friday, novice traders might consider trading around the 1.0797-1.0804 area. However, it's important to note that significant U.S. data will be released today, which could prompt a rise in the pair.
The key levels to consider on the 5M timeframe are 1.0526, 1.0568, 1.0611, 1.0678, 1.0726-1.0733, 1.0797-1.0804, 1.0838-1.0856, 1.0888-1.0896, 1.0940, and 1.0971-1.0981. No major reports are scheduled for the Eurozone on Friday, but the U.S. will release crucial NonFarm Payrolls and unemployment rate data. Significant movements are expected in the second half of the day.
Basic rules of the trading system:
1) The strength of a signal is determined by the time it took for the signal to form (bounce or level breakthrough). The shorter the time required, the stronger the signal.
2) If two or more trades around a certain level are initiated based on false signals, subsequent signals from that level should be ignored.
3) In a flat market, any currency pair can produce multiple false signals or none at all. In any case, it's better to stop trading at the first signs of a flat market.
4) Trades should be opened between the start of the European session and mid-way through the U.S. session. All trades must be closed manually after this period.
5) In the hourly time frame, trades based on MACD signals are only advisable amidst substantial volatility and an established trend, confirmed either by a trendline or trend channel.
6) If two levels are too close to each other (from 5 to 20 pips), they should be considered as a support or resistance zone.
7) After moving 15 pips in the intended direction, the Stop Loss should be set to break-even.
What's on the charts:
Support and Resistance price levels can serve as targets when buying or selling. You can place Take Profit levels near them.
Red lines represent channels or trend lines that depict the current trend and indicate the preferred trading direction.
The MACD (14,22,3) indicator, encompassing both the histogram and signal line, acts as an auxiliary tool and can also be used as a source of signals.
Important speeches and reports (always noted in the news calendar) can profoundly influence the price dynamics. Hence, trading during their release calls for heightened caution. It may be reasonable to exit the market to prevent abrupt price reversals against the prevailing trend.
Beginners should always remember that not every trade will yield profit. Establishing a clear strategy, coupled with effective money management, is key to long-term success in trading.Pentru mai multe detalii, va invitam sa vizitati stirea originala.
Review of EUR/USD on August 2; Results of the Fed meeting. Why did the dollar rise?
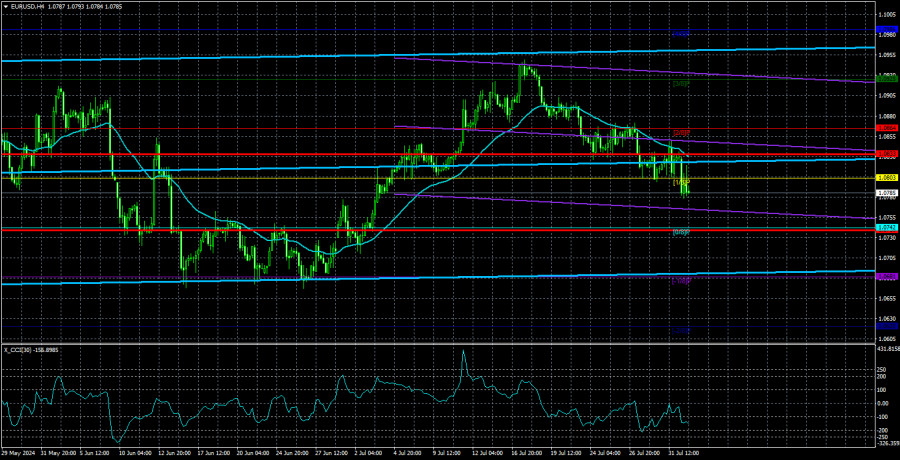
EUR/USD sustained its weak decline throughout Thursday. Some might think, looking at the charts, that the price plummeted several times on Wednesday and Thursday. However, in reality, volatility remains at a very low level. Nothing seems to help: neither macroeconomic data nor fundamental events such as central bank meetings. Therefore, the first thing to understand is that the market still wants to refrain from actively trading.
We've been talking about this for a long time. If the pair moves 40 pips daily, expecting a 100-pip move on any event is foolish. And even if such a move occurs, it will be an exception to the rule. In yesterday's article, we deliberately did not discuss the results of the Federal Reserve meeting, although, in essence, there was nothing to discuss. As expected, the key rate remained unchanged, and Fed Chair Jerome Powell's speech could be interpreted in any direction. However, we can note an increase in dovish rhetoric from the Fed head. Powell mentioned that the central bank might lower the key rate in September. He did not say that the Fed would lower it but that it might lower it. The Fed could just as easily lower the rate later this year or could have reduced it in July. However, such phrases were absent from his previous speeches.
We still believe that inflation does not yet allow the Fed to consider lowering rates. Powell noted that inflation slowed in the second quarter, giving confidence in this indicator moving towards 2%. Powell also mentioned the PCE index, which stood at 2.6% at the end of the second quarter. He also noted the core PCE, which was 2.9%. In his view, these indicators are very important but not the only ones considered when making monetary policy decisions.
Powell also indicated that monetary policy will remain restrictive for some time, but rates may begin to decrease. The current rate level is much higher than the "neutral" level, so even several stages of easing will maintain a "restrictive" policy. From everything Powell said, it can be concluded that the Fed is approaching its first rate cut. We do not believe it will happen in September, but the market is 100% confident. So why did the dollar rise yesterday and today?
It's simple—the horizontal channel on the 24-hour TF. We've been saying for several weeks that the price has been trading between 1.0600 and 1.1000 levels since the beginning of the year, and the fundamental and macroeconomic background only has a local impact on the pair's movement. And even then, not always. For several weeks, we observed an illogical rise in the euro, and now we can and will likely observe the same illogical rise in the dollar. We also mentioned that the market has anticipated the first Fed rate cut "in advance" for 7-8 months. Recall that initially, everyone expected rate cuts back in March. Therefore, we do not expect further growth from the EUR/USD pair. First, we expect it to fall to around the 1.0600 level or so.
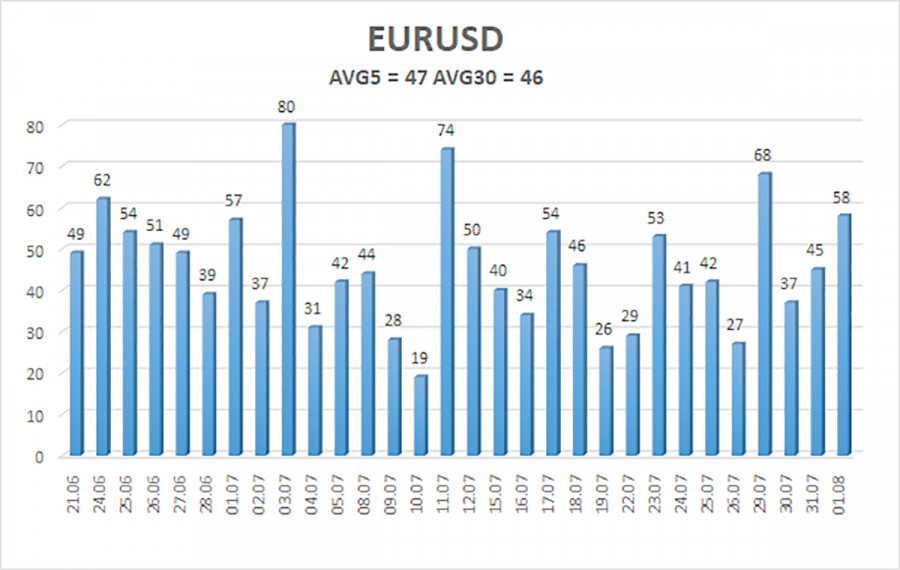
The average volatility of the EUR/USD pair over the past five trading days as of August 2 is 47 pips, which is considered low. We expect the pair to move between the levels of 1.0739 and 1.0833 on Friday. The higher linear regression channel is directed upwards, but the global downward trend persists. The CCI indicator entered the overbought area, a warning of a trend direction change.
Nearest Support Levels:
- S1 – 1.0742
- S2 – 1.0681
- S3 – 1.0620
Nearest Resistance Levels:
- R1 – 1.0803
- R2 – 1.0864
- R3 – 1.0925
Trading Recommendations:
The EUR/USD pair maintains a global downward trend; a weak decline continues in the 4-hour time frame. In previous reviews, we mentioned that we are only expecting the continuation of the global downward trend. We do not believe the euro can start a new global trend amid the European Central Bank's monetary policy easing, so the pair will likely fluctuate between 1.0600 and 1.1000 for some time. Since the price has reversed in the upper part of this range, short positions with targets around the Murray level "-1/8" - 1.0681 remain valid.
Explanations for Illustrations:
Linear Regression Channels: help determine the current trend. If both are directed in the same direction, it means the trend is strong.
Moving Average Line (settings 20,0, smoothed): determines the short-term trend and the direction in which trading should be conducted.
Murray Levels: target levels for movements and corrections.
Volatility Levels (red lines): the probable price channel in which the pair will spend the next 24 hours, based on current volatility indicators.
CCI Indicator: Entering the oversold area (below 250) or the overbought area (above +250) means a trend reversal is approaching.
The material has been provided by InstaForex Company - www.instaforex.com #Indicator analysis: Daily review of GBP/USD on August 1, 2024
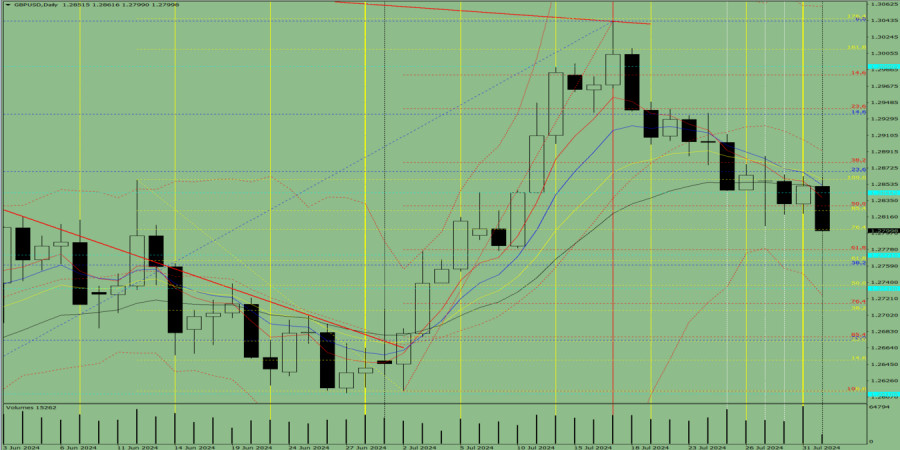
Today, GBP/USD may sustain the decline from 1.2852 (the close of yesterday's daily candle) with a target of 1.2778 – the 61.8% pullback level (red dashed line). Upon reaching this level, the price may start rising with a target of 1.2829 – the 50% pullback level (red dashed line).
Fig. 1 (daily chart)
Comprehensive Analysis:
* Indicator Analysis – Down
* Fibonacci Levels – Down
* Volumes – Down
* Candlestick Analysis – Down
* Trend Analysis – Down
* Weekly Chart – Down
* Bollinger Bands – Down
General Conclusion:
Today, GBP/USD may sustain the decline from 1.2852 (the close of yesterday's daily candle) with a target of 1.2778 – the 61.8% pullback level (red dashed line). Upon reaching this level, the price may start rising with a target of 1.2829 – the 50% pullback level (red dashed line).
Alternative Scenario: The pair may sustain the decline from 1.2852 (the close of yesterday's daily candle) with a target of 1.2801 – the 76.4% pullback level (yellow dashed line). Upon reaching this level, the price may start rising with a target of 1.2829 – the 50% pullback level (red dashed line).
Stefan Doll,
Analytical expert of InstaForex
© 2007-2024
Pentru mai multe detalii, va invitam sa vizitati stirea originala.
Trading plan for GBP/USD on August 1. Simple tips for beginners
GBP/USD on 1H chart
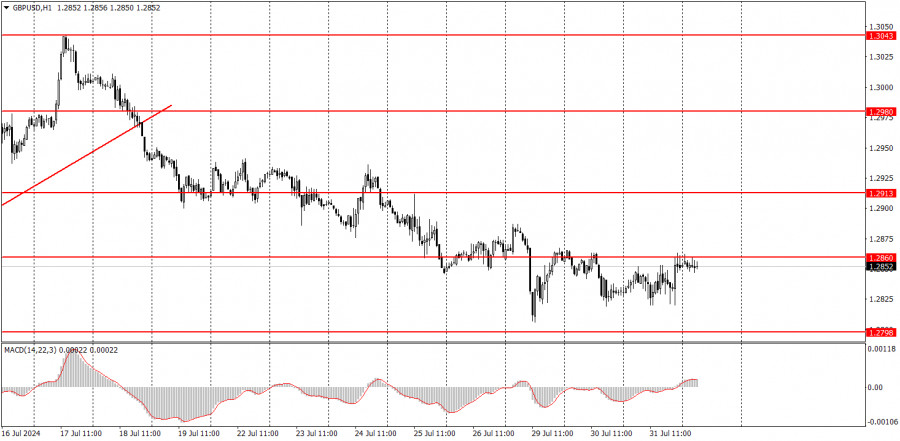
On Wednesday, the GBP/USD pair also continued to trade sideways with low volatility. The range from the day's low to high was only 43 pips. And this was on the day of the FOMC meeting... What can be said about other events like the ADP report? The market had been consistently selling the British pound for several weeks, but the pair has just been standing still this week. Today, the Bank of England meeting will take place, where a decision to begin a cycle of monetary policy easing might be made. In theory, such news should provoke a strong market reaction. However, in practice, we doubt we will see a promising trend today. If the market does not want to trade, no news will make it do so.
In addition to low volatility this week, traders have faced a flat market, which is visible on the hourly time frame. The macroeconomic background has no impact on the pair's movement. A market reaction to an event amounting to 20 pips is unlikely to interest anyone.
GBP/USD on 5M chart
Two trading signals were formed in the 5-minute time frame on Wednesday. The price twice rebounded from the 1.2848-1.2860 area. In the first case, it moved 15 pips in the intended direction, and in the second case, 20 pips. We remind novice traders that if there are no market movements, it is impossible to make a profit from any trading signals. The problem is not with the levels but the market's unwillingness to trade.
Trading tips on Thursday:
GBP/USD can continue the new downtrend in the hourly time frame. The pair has breached the ascending trendline, so we might observe a decline for at least a couple of weeks rather than growth. Ideally, the pound should drop by at least 400-500 pips. The market has already processed all the bullish factors about three times, the dollar is undervalued, and the BoE may start lowering its rates as early as this week. The British currency has more reasons to fall than to start a new rise.
On Thursday, novice traders may trade within the range of 1.2848-1.2860. If the price bounces from this range, traders may open new short positions, while a consolidation above this mark will enable long positions.
The key levels to consider on the 5M timeframe are 1.2605-1.2633, 1.2684-1.2693, 1.2748, 1.2791-1.2798, 1.2848-1.2860, 1.2913, 1.2980-1.2993, 1.3043, 1.3102-1.3107, 1.3145. Today, the results of the BoE meeting will be announced, and there will also be a speech by BoE Governor Andrew Bailey. In the U.S., the important ISM Manufacturing PMI will be released. However, even with this set of events, we have low expectations for a strong movement during the day.
Basic rules of a trading system:
1) The strength of a signal is determined by the time it took for the signal to form (bounce or level breakthrough). The shorter the time required, the stronger the signal.
2) If two or more trades around a certain level are initiated based on false signals, subsequent signals from that level should be ignored.
3) In a flat market, any currency pair can produce multiple false signals or none at all. In any case, it's better to stop trading at the first signs of a flat market.
4) Trades should be opened between the start of the European session and mid-way through the U.S. session. All trades must be closed manually after this period.
5) In the hourly time frame, trades based on MACD signals are only advisable amidst substantial volatility and an established trend, confirmed either by a trendline or trend channel.
6) If two levels are too close to each other (from 5 to 20 pips), they should be considered as a support or resistance zone.
7) After moving 15 pips in the intended direction, the Stop Loss should be set to break-even.
What's on the charts:
Support and Resistance price levels can serve as targets when buying or selling. You can place Take Profit levels near them.
Red lines represent channels or trend lines that depict the current trend and indicate the preferred trading direction.
The MACD (14,22,3) indicator, encompassing both the histogram and signal line, acts as an auxiliary tool and can also be used as a source of signals.
Important speeches and reports (always noted in the news calendar) can profoundly influence the price dynamics. Hence, trading during their release calls for heightened caution. It may be reasonable to exit the market to prevent abrupt price reversals against the prevailing trend.
Beginners should always remember that not every trade will yield profit. Establishing a clear strategy, coupled with effective money management, is key to long-term success in trading.Pentru mai multe detalii, va invitam sa vizitati stirea originala.
Forecast for EUR/USD on August 1, 2024
Our assumption yesterday about the Federal Reserve's focus on changing the forecast for the number of rate cuts by the end of the year was confirmed. At the press conference, Fed Chair Jerome Powell indicated that the central bank is paying close attention to the labor market, and the rate may not be lowered by the year's end. The Fed's dual mandate is emphasized during periods when current conditions should be maintained. However, the market reacted very weakly to these signals. It's possible that investors were more concerned about winding down carry trades with the yen, as earlier in the morning, the Bank of Japan raised its rate from 0.10% to 0.25% and announced a gradual reduction of its bond purchases on its balance sheet.
If we see the Fed's reluctance to lower rates and the exit from carry trades, there should be a capital flow into dollars. The difficulty lies in the fact that investors are once again investing in equities (S&P 500 up 1.58%), commodities (oil up 5.10%), and gold (up 1.58%). Tomorrow, U.S. employment data for July will be released. The forecast for new jobs in the non-farm sector is 177,000, down from June's 206,000. The optimistic forecast means the Fed has a reason to cool down investor enthusiasm.
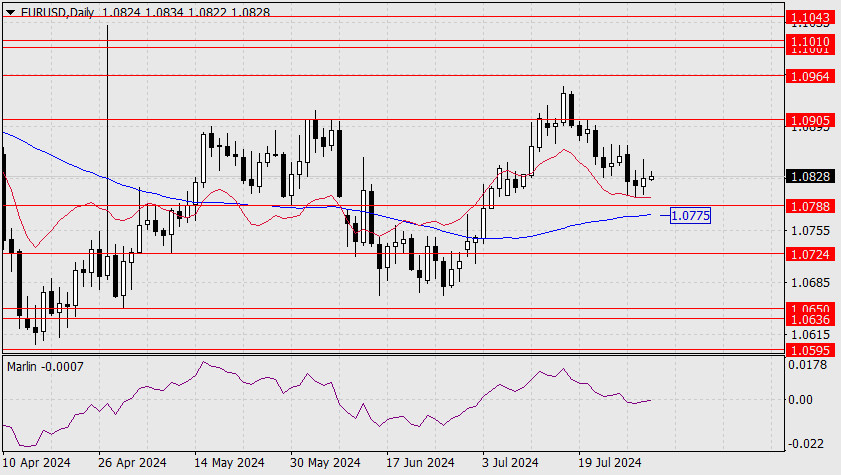
On the daily chart, the price has moved upwards from the support of the balance line, which indicates short-term interest in buying. The Marlin oscillator is considering crossing into bullish territory. The pair may continue to rise until tomorrow's non-farm payrolls data is released.
On the 4-hour chart, the price's convergence with the oscillator has proven effective. Marlin is already rising in positive territory, and the price is attempting to climb above the balance line. Above the balance line, there is resistance from the MACD line at 1.0850, which coincides with yesterday's peak. The convergence effect may dissipate here. Consequently, the price will likely move sideways until tomorrow evening (gray rectangle).
Pentru mai multe detalii, va invitam sa vizitati stirea originala.
Forecast for AUD/USD on August 1, 2024
AUD/USD
Yesterday's distinctly marked level of 0.6482, which was the day's low and strong support on April 1 and March 5, led to a revision of other target levels with a range of 300 pips, but overall, the downtrend remains intact.
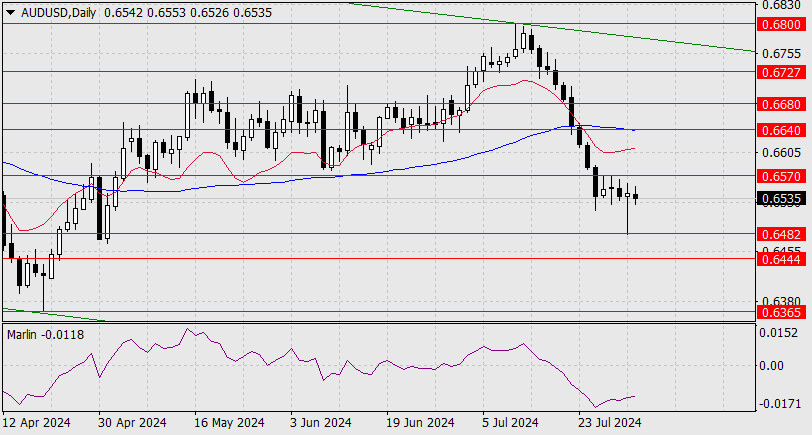
As of this morning, the price continues to consolidate below the 0.6570 level but intends to break through 0.6444 (the February low). If the price consolidates below this level, it will continue to fall towards 0.6365.
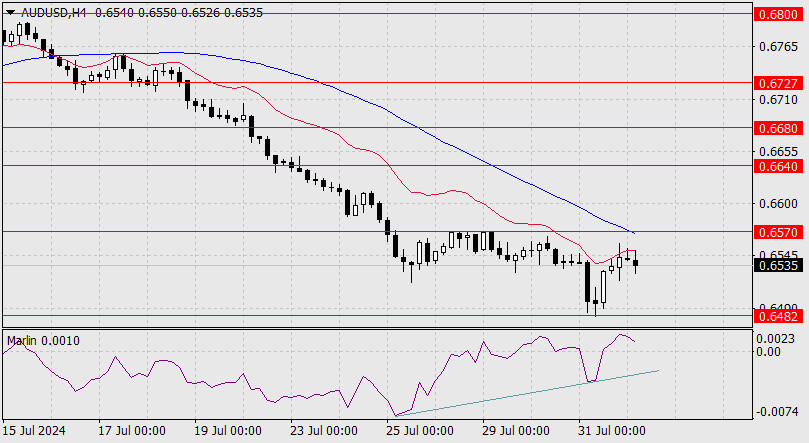
On the 4-hour chart, the price and the Marlin oscillator have formed a convergence, complicating their downward movement. However, it is likely that the aussie is not in a hurry to anticipate events before the release of U.S. employment data tomorrow. The MACD line supports the 0.6570 resistance. We expect the pair to move sideways.
The material has been provided by InstaForex Company - www.instaforex.com #Review of EUR/USD on August 1; European data: neither cold nor hot
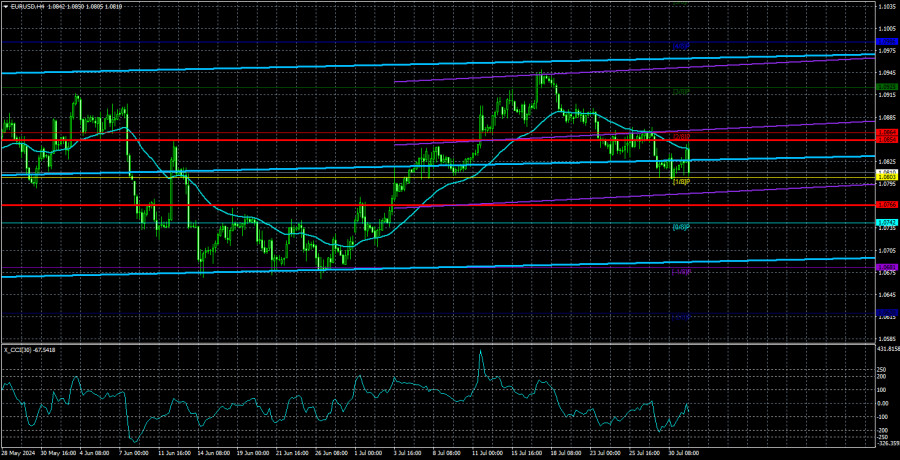
EUR/USD traded marginally higher for most of Wednesday. As usual, we will not analyze the FOMC meeting results immediately after it takes place, as we believe it will take at least a day for the market to "digest" all the information. Therefore, the analysis of the U.S. central bank's meeting will be done tomorrow. For now, let's focus on another equally important and interesting event: the Eurozone inflation report.
Yesterday, we learned that the Consumer Price Index accelerated from 2.5% year-on-year to 2.6%, while the market expected it to decrease to 2.4%. What do these figures mean? The chances of seeing a second European Central Bank rate cut in September have slightly decreased. ECB representatives have repeatedly stated that everything will depend on incoming macroeconomic information. However, the market doesn't care what ECB or Federal Reserve officials say. The market decides on its own when the ECB should cut rates and how often the Fed will cut rates in 2024. Unfortunately, central bank officials have been right so far.
After the release of the report above, the euro, of course, rose by a couple of dozen pips, but to say that this indicator caused volatility would be an overstatement. We have often said that the main problem now is low volatility, which tends to decrease further. The illustration below clearly shows what we mean. The pair moves 40-45 pips per day. On the best days, 60-80 pips. And there have been only four super-successful days in the last month and a half. What is there to talk about?
The fact that inflation is rising in the Eurozone, in itself, doesn't mean much for the euro. Not anymore. The ECB has begun easing monetary policy, while the Fed won't start for at least a few months (we don't believe in a rate cut in September). The EUR/USD pair has been within a narrow range of 1.06-1.10 for seven months, trading purely on technicals. For several weeks, the euro rose for any reason, and now the dollar can similarly rise.
Yesterday, the ADP report on private sector employment (similar to NonFarm Payrolls) also exerted pressure on the dollar. Frankly, this indicator has always been less significant than the classic NonFarms, but another disappointing report from the U.S. triggered a new drop in the dollar. However, when the market received strong reports from the U.S., it also didn't rush to buy the dollar. Therefore, we consider the flat on the daily timeframe as the main trend. Trading should be based on this. We believe that the euro still has the potential to fall. There are currently no reversal signals on the 4-hour timeframe.
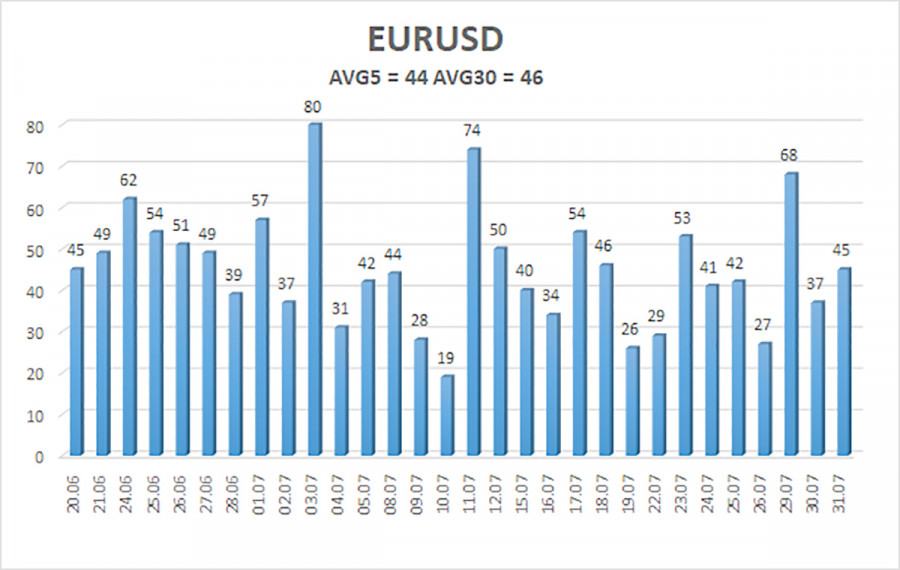
The average volatility of the EUR/USD pair over the past five trading days as of August 1st is 44 pips, which is considered low. We expect the pair to move between the levels of 1.0766 and 1.0854 on Thursday. The higher linear regression channel is directed upwards, but the global downward trend persists. The CCI indicator entered the overbought area, a warning of a trend direction change.
Nearest Support Levels:
- S1 – 1.0803
- S2 – 1.0742
- S3 – 1.0681
Nearest Resistance Levels:
- R1 – 1.0864
- R2 – 1.0925
- R3 – 1.0986
Trading Recommendations:
The EUR/USD pair maintains a global downward trend; a downward movement continues in the 4-hour time frame. In previous reviews, we mentioned that we are only expecting the continuation of the global downward trend. We do not believe the euro can start a new global trend amid the ECB's monetary policy easing, so the pair will likely fluctuate between 1.0600 and 1.1000 for some time. Since the price has reversed in the upper part of this range, short positions with targets around the Murray level "-1/8" - 1.0681 remaid valid.
Explanations for Illustrations:
Linear Regression Channels – help determine the current trend. If both are directed in the same direction, it means the trend is strong.
Moving Average Line (settings 20,0, smoothed) – determines the short-term trend and the direction in which trading should be conducted.
Murray Levels – target levels for movements and corrections.
Volatility Levels (red lines) – the probable price channel in which the pair will spend the next 24 hours, based on current volatility indicators.
CCI Indicator: Entering the oversold area (below 250) or the overbought area (above +250) means a trend reversal is approaching.
The material has been provided by InstaForex Company - www.instaforex.com #The euro confused the opponent
Central banks' decisions are heavily reliant on data, but sometimes, that data can be mind-boggling. Consumer prices in Germany and the Netherlands unexpectedly accelerated, while in Spain and France, they were below forecasts. Eurozone inflation at 2.6% also exceeded Bloomberg experts' estimates. Core inflation was anchored at 2.9%, and service prices slightly decreased from 4.1% to 4% in July. The situation remains complex, with one more report to be released before the European Central Bank's September meeting.
According to Governing Council member Isabel Schnabel, deviations in the trend can be either isolated or systematic. In the first case, rates will continue to go down. In the second case, it's worth monitoring the data closely to avoid premature monetary policy easing. At first glance, July's CPI report increases the risks of maintaining the deposit rate at 3.75%, which is good for EUR/USD.
Dynamics of European Inflation
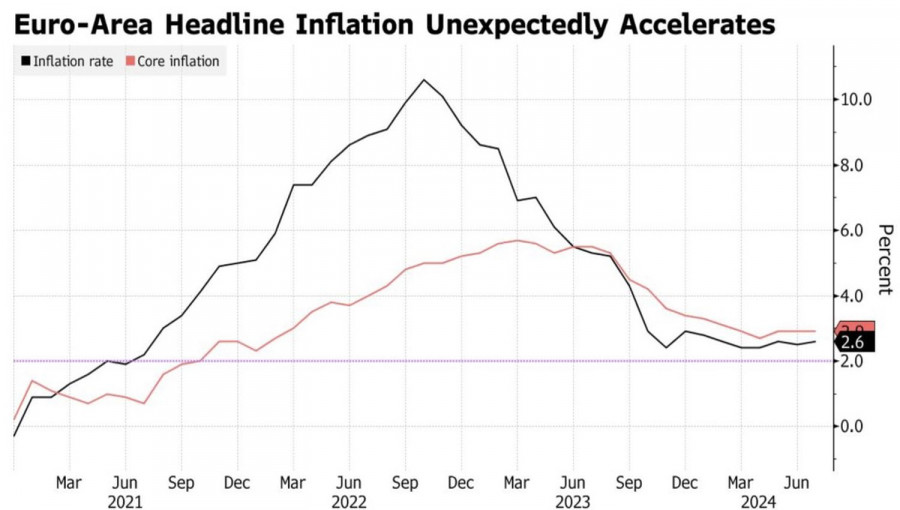
However, the futures market believes in a rate cut of 59 basis points by the end of 2024. This refers to two acts of 25 basis points, each with a slight probability of a third. If not in September, then when? It's no surprise that after two steps forward, the euro took a step back. Investors still need clear answers from the ECB and continue waiting for Federal Reserve signals.
What could those hints be? The U.S. central bank might note progress in the fight against inflation and state that monetary policy is excessively tight. It could express concerns about the labor market's fate and emphasize the shifting balance of two-sided risks. If inflation slows and unemployment rises, it's time to lower the federal funds rate. And the closer we get to the start of monetary easing, the worse it will be for the U.S. dollar.
Does this mean that EUR/USD will quickly surge? Not necessarily. The euro is a pro-cyclical currency that loses ground in a slowing global GDP environment. Moreover, no one has canceled the divergence in economic growth between the United States and the eurozone.
Dynamics of US and Eurozone GDP
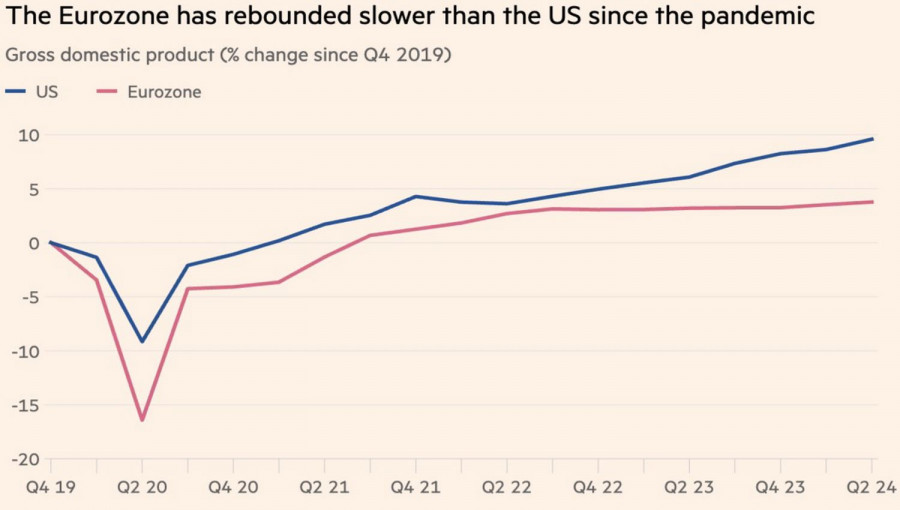
Signs of a slowing global economy are visible. This includes declining purchasing managers' indices, an unscheduled easing of monetary policy by the People's Bank of China, and data on the U.S. labor market and inflation. The situation could worsen further if Donald Trump returns to power in the U.S. with his tariffs and trade wars. In such a scenario, expecting consolidation of the main currency pair makes sense.
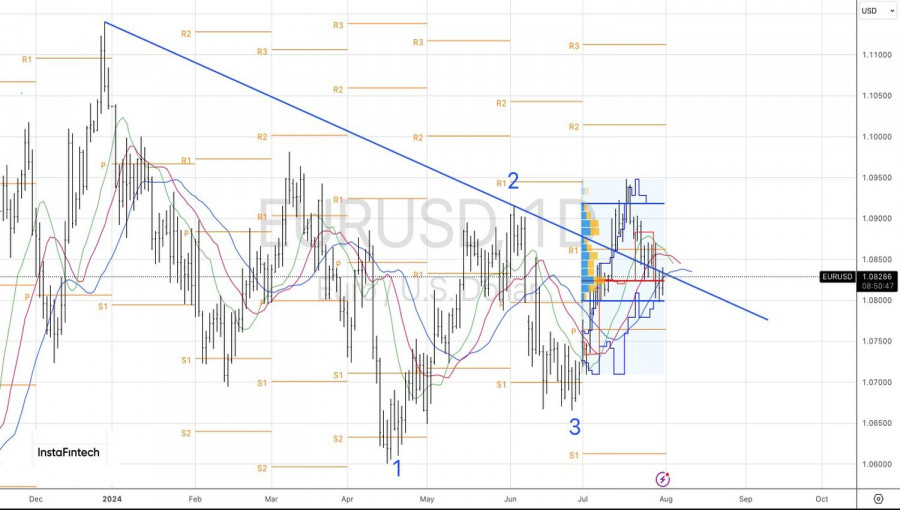
Technically, the bulls attempt to push EUR/USD quotes beyond the trendline on the daily chart. If successful, the long positions formed from 1.0790-1.0800 should be held and periodically increased. The target levels for the upward movement are 1.0865 and 1.0900.
The material has been provided by InstaForex Company - www.instaforex.com #Forex forecast 07/31/2024: EUR/USD, USD/JPY, USDX, Gold, SP500 and Bitcoin from Sebastian Seliga
Video Agenda:
00:00 INTRO
00:30 Totay's key events: Manufacturing PMI, BoJ Press Conference, ADP Nonfarm Employment Change, Pending Home Sales, Crude Oil Inventories, Fed Interest Rate Decision, FOMC Statement
03:31 USDX
05:03 EUR/USD
06:53 USD/JPY
09:16 GOLD
11:06 SP500
12:51 BTC/USD
Useful links:
My other articles are available in this section
InstaForex course for beginners
Popular Analytics
Open trading account
Important:
The begginers in forex trading need to be very careful when making decisions about entering the market. Before the release of important reports, it is best to stay out of the market to avoid being caught in sharp market fluctuations due to increased volatility. If you decide to trade during the news release, then always place stop orders to minimize losses.
Without placing stop orders, you can very quickly lose your entire deposit, especially if you do not use money management and trade large volumes. For successful trading, you need to have a clear trading plan and stay focues and disciplined. Spontaneous trading decision based on the current market situation is an inherently losing strategy for a scalper or daytrader.
#instaforex #analysis #sebastianseliga Pentru mai multe detalii, va invitam sa vizitati stirea originala.
GBP/USD: trading tips for beginners for the European session on July 31
Forecast
Back
Forecast
GBP/USD: trading tips for beginners for the European session on July 31
Overview of trading and tips on
The premium article will be available in
00:00:00
31.07.2024 10:03 AM
The premium article will be available in00:00:00
31.07.2024 10:03 AM
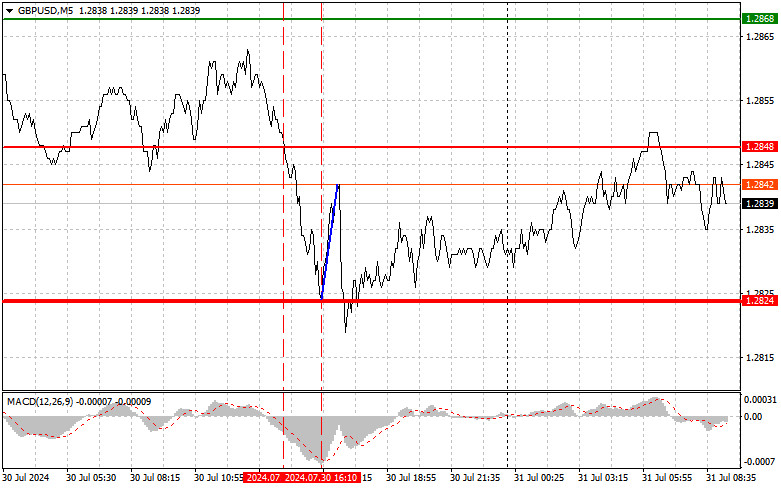
Overview of trading and tips on GBP/USDThe price test of 1.2848 occurred when the MACD indicator started to move down from the zero mark, confirming the correct entry point for selling the pound further along the trend. As a result, GBP/USD fell by more than 20 pips. Buying on the rebound at 1.2824 allowed traders to gain about ten pips of profit. Today, the UK economic calendar is empty, so buyers may get a chance for an upward trend, but
Fresh articles are available only to premium users
Read analytics in early access, getting information first
Get
Pentru mai multe detalii, va invitam sa vizitati stirea originala.
