CFTC report: faith in the dollar grows stronger

#

The net long USD position increased by 7.2 billion to 32.6 billion over the reporting week. Speculative investors are actively buying the dollar, as they increasingly believe that the US currency will strengthen in the coming weeks.

The European currencies registered the biggest losses – the euro, pound, and franc, as well as the Japanese yen, while commodity currencies posted minor changes.

analytics662fab4886833.jpg

The Federal Reserve meeting on Wednesday, May 1st, will be this week's main event. This should be a standard meeting with no forecasts, as the main focus will be on Fed Chief Jerome Powell's press conference. Powell is expected to adopt a more hawkish tone, confirming the consensus regarding a slower trajectory of interest rate cuts.

As of Monday morning, the markets anticipate only one rate cut this year. According to CME data, the futures market implies a quarter-point rate cut in September, with the next cut not until March 2025. This trajectory is smoother than was assumed very recently and generally favors higher yields, and consequently, the dollar.

analytics662fab5734087.jpg

An unpleasant surprise emerged last week as US GDP growth slowed to 1.6% in the first quarter, below the long-term trend and significantly lower than expectations. The ISM Manufacturing PMI will be released on Tuesday, and if it falls below the forecast of 50.1, which seems plausible, it will suggest that the economy is cooling and will reinforce the Fed's expectations regarding further progress in slowing inflation.

Overall, the situation continues to favor a stronger dollar, reflected in yield dynamics. 10-year US Treasuries fell to 3.79% in December, reflecting market expectations of an imminent Fed rate cut, but in April, yields rose to 4.75%, persistently approaching the October peak of 5.02%.

There is no doubt that the US dollar is still the favorite instrument in the currency market. Structural problems in the US economy, such as rapidly growing government debt and budget deficits, currently do not influence investor preferences—faith in a strong dollar outweighs any concerns.

The material has been provided by InstaForex Company - www.instaforex.com #

The euro should surrender. Resistance is futile

#

On Monday, the EUR/USD bulls tried to advance with the help of hawkish comments from the European Central Bank officials, Spain's inflation data, and rumors of a ceasefire between Israel and Hamas. However, the accelerating pace of growth in the US Personal Consumption Expenditures Index looms over opponents of the US dollar. Especially in the run-up to the Federal Reserve meeting and the release of labor market data.

According to Pierre Wunsch, a member of the ECB's Governing Council, the ECB should be cautious about the signal that a second consecutive interest-rate cut in July would send to investors. "Cutting again in July would be interpreted by markets to mean that we're going to cut every meeting," the Belgian central-bank chief was cited as saying. Wunsch expects good news and predicts only two rate cuts in 2024.

This may be the case, as Spanish inflation has been accelerating for the second consecutive month against the backdrop of the government's withdrawal of support measures to combat the energy crisis. This immediately brings to mind the ECB's forecasts that CPI will anchor in the near future. If so, expecting aggressive monetary expansion from Frankfurt is not worth it.

Inflation dynamics in Spain

analytics662f9fab9c6ce.jpg

The concerns of ECB officials against the backdrop of accelerating CPI growth rates may seem logical at first glance. Rapid loosening of monetary policy could lead to a decline in the euro exchange rate and an increase in imported inflation. However, Credit Agricole is ready to argue against this. The bank says the impact of a weaker currency on prices has diminished in recent years. A 10% decline in the nominal effective exchange rate slows CPI by 0.2-0.3 percentage points over four quarters, rather than the previously estimated 0.5 points. In addition, the trade-weighted exchange rate of the regional currency remains stable, unlike the decline in EUR/USD.

It seems that the fears of ECB representatives are unfounded, which opens the door for monetary policy easing in the euro area, but the situation is different in the US. Three consecutive months of accelerated Personal Consumption Expenditures mean that for the rest of the year, the PCE index should increase by an average of 0.2% month-on-month to reach the Fed's forecast of 2.6% by the end of 2024.

Dynamics and structure of inflation in the US

analytics662f9fb67efa7.jpg

analytics662f9fc303254.jpg

It's no wonder that the market strongly doubts the feasibility of the FOMC's March forecast of three rate cuts. At best, risk asset enthusiasts will get two cuts. This is bad news for US stocks. If borrowing costs remain unchanged and the yield on 10-year Treasury bonds continues to rally towards 5%, tight financial conditions will hinder the economy.

Technically, on the EUR/USD daily chart, the bulls' failure to keep the pair's quotes above the pivot level of 1.071 and the formation of a bar with a long upper shadow shows their weakness. It makes sense to sell towards 1.064 and 1.061.

The material has been provided by InstaForex Company - www.instaforex.com #

Trading Signals for GBP/USD for April 29-30, 2024: sell below 1.2553 (200 EMA - overbought)

GBP/USD is trading around 1.2546 within the uptrend channel forming since April 22 but showing exhaustion of bullish strength as it encountered strong resistance around the 200 EMA located at 1.2553.

In case the bullish trend prevails, the British pound should consolidate above 1.2573. Then, we could look for opportunities to buy at 8/8 Murray targets at 1.2696 and 1.2840.

In case GBP encounters rejection around 1.2553 (200 EMA) or 1.2573 (7/8 Murray) and fails to consolidate above this area, it will be seen as a signal to sell, with the target at the 21 SMA located at 1.2492.

The outlook remains positive for the pound sterling, but a change and a sharp break of the uptrend channel could change the outlook and GBP/USD could resume its bearish cycle and could reach 5/8 of Murray at 1.2329. Finally, the instrument could fall to 4/8 of Murray located at 1.2207.

A sharp break of the uptrend channel below 1.2490 will be seen as a signal to sell since the eagle indicator has been moving in an overbought area since April 26. Therefore, a technical correction is imminent in the coming days.

Pentru mai multe detalii, va invitam sa vizitati stirea originala.

Video market update for April 29, 2024

Instant Trading Ltd, reg. number 1811672


Address: 4th Floor, Water's Edge Building, Meridian Plaza, Road Town, Tortola, British Virgin Islands


License number SIBA/L/14/1082 issued by the BVI FSC


Insta Service Ltd is registered with FSC Saint Vincent, Reg. Number IBC22945


Insta Global Ltd. registered in Saint Vincent, IBC24321


Services are provided under InstaForex brand which is a registered trademark.


Copyright © 2007-2024 InstaForex. All rights reserved. Financial services are provided by InstaFintech Group.
Pentru mai multe detalii, va invitam sa vizitati stirea originala.

Forecast for EUR/USD on April 29, 2024

The premium article will be available in00:00:00

29.04.2024 06:00 AM


EUR/USDOn Friday, the euro fell by 36 pips on significant trading volumes. The reason behind this was the US inflation data, as US PCE inflation rose by 2.7% YoY in March, compared to 2.5% prior. So now the market only expects one rate cut from the Federal Reserve this year, which has a 60% chance.Concerns have intensified, as some believe a potential rate hike may happen by the end of the year (in December), especially since the Fed has suggested


Fresh articles are available only to premium users


Read analytics in early access, getting information first
Get

Pentru mai multe detalii, va invitam sa vizitati stirea originala.

Trading plan for EUR/USD on April 29. Simple tips for beginners

#

Analyzing Friday's trades:

EUR/USD on 1H chart

analytics662df362ecd76.jpg

EUR/USD started falling on Friday, which was justified by technical reasons. Over the past few days, the price has been hovering near the upper boundary of the ascending channel, so a bounce from it and a shift towards a downward movement seemed likely. The movement didn't even require a corresponding macroeconomic backdrop. The US reports published throughout the day did not unequivocally support the greenback. To be more precise, there were four US reports, three of which cannot be considered strong for the greenback. Overall, US reports left much to be desired this week. The most disappointing was the GDP report for the first quarter, which unexpectedly slowed down to 1.6%. Actually, the slowdown in the US economy cannot be considered something extraordinary, given that the Federal Reserve's policy has been quite hawkish for quite some time. However, we still expected a higher value. And we were not alone.

EUR/USD on 5M chart

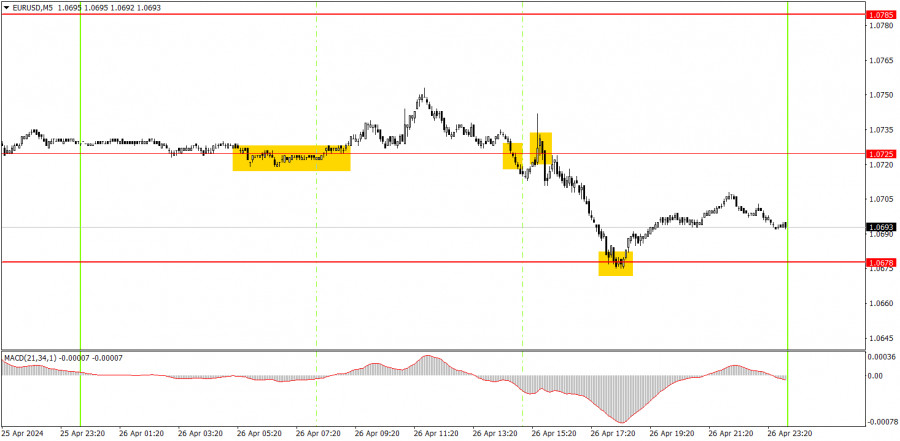
Several trading signals were generated on the 5-minute timeframe. At the beginning of the European trading session, the pair bounced off the level of 1.0725 but only managed to rise by 15 pips, which was enough to set the stop loss to breakeven. Then, two sell signals were formed near the same level of 1.0725, after which the price reached the nearest target level of 1.0678. The profit from the short position was about 25 pips. The bounce from the level of 1.0678 could also have been executed, but this signal formed quite late, so it was better not to enter the market before its closure.

analytics662df36bb5058.jpg

Trading tips on Monday:

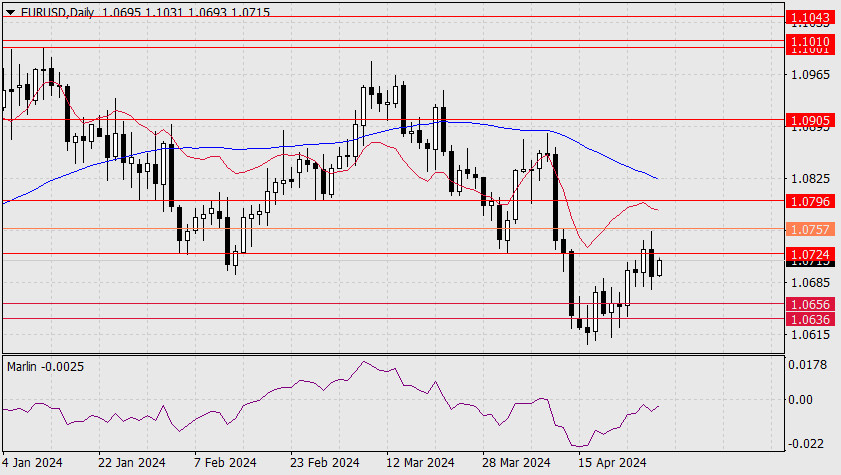
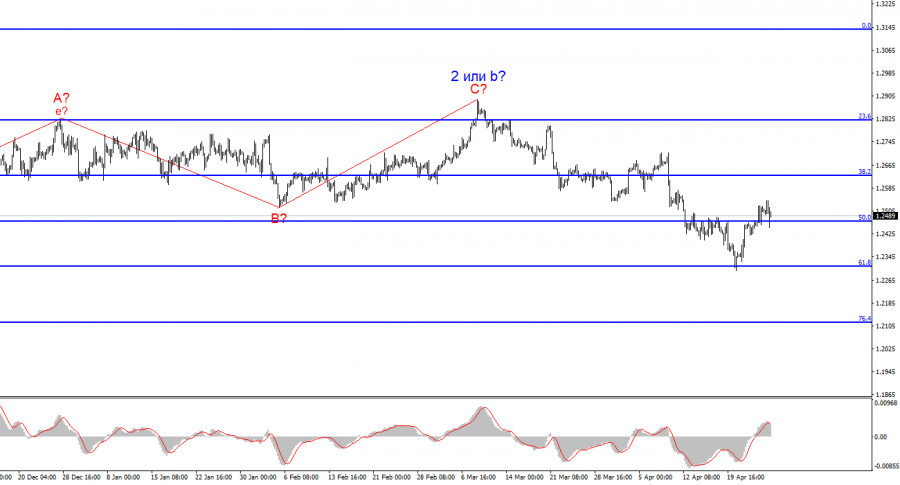
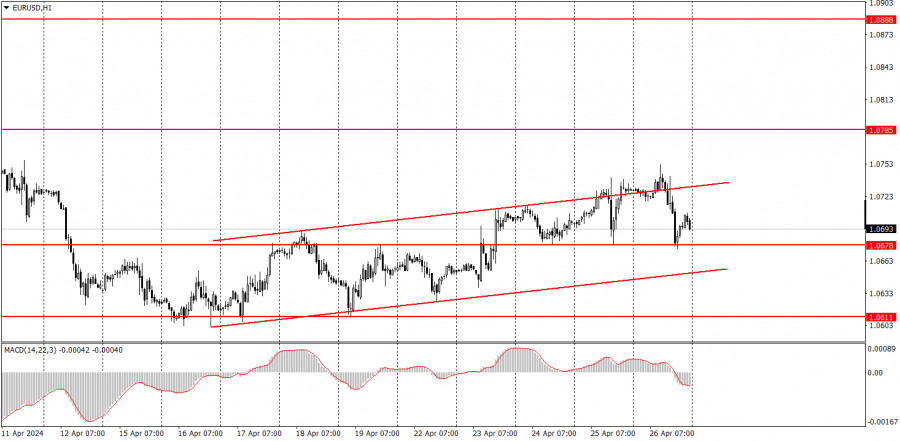
On the hourly chart, the downtrend persists, but the EUR/USD pair is currently correcting higher. We believe that the euro should continue to fall in the medium term, as it is still too high, and in general, the trend is headed downwards. However, at the moment, the market is likely taking a break before it starts a new downward movement.

On Monday, the pair may resume its downward movement as it bounced off the upper boundary of the channel. If the price consolidates below the ascending channel, it would signal the start of a new leg in the downward trend.

The key levels on the 5M chart are 1.0483, 1.0526, 1.0568, 1.0611, 1.0678, 1.0725, 1.0785-1.0797, 1.0838-1.0856, 1.0888-1.0896, 1.0940, 1.0971-1.0981. The eurozone will publish an important inflation report for Germany. Inflation is expected to accelerate to 2.3%, which is not critical for either the European Central Bank or the euro. It may only provoke a market reaction in the case of a significant deviation of the actual value from the forecast. The market may buy the euro if inflation accelerates.

Basic trading rules:

1) Signal strength is determined by the time taken for its formation (either a bounce or level breach). A shorter formation time indicates a stronger signal.

2) If two or more trades around a certain level are initiated based on false signals, subsequent signals from that level should be disregarded.

3) In a flat market, any currency pair can produce multiple false signals or none at all. In any case, the flat trend is not the best condition for trading.

4) Trading activities are confined between the onset of the European session and mid-way through the U.S. session, after which all open trades should be manually closed.

5) On the 30-minute timeframe, trades based on MACD signals are only advisable amidst substantial volatility and an established trend, confirmed either by a trendline or trend channel.

6) If two levels lie closely together (ranging from 5 to 15 pips apart), they should be considered as a support or resistance zone.

How to read charts:

Support and Resistance price levels can serve as targets when buying or selling. You can place Take Profit levels near them.

Red lines represent channels or trend lines, depicting the current market trend and indicating the preferable trading direction.

The MACD(14,22,3) indicator, encompassing both the histogram and signal line, acts as an auxiliary tool and can also be used as a signal source.

Significant speeches and reports (always noted in the news calendar) can profoundly influence the price dynamics. Hence, trading during their release calls for heightened caution. It may be reasonable to exit the market to prevent abrupt price reversals against the prevailing trend.

Beginning traders should always remember that not every trade will yield profit. Establishing a clear strategy coupled with sound money management is the cornerstone of sustained trading success.

The material has been provided by InstaForex Company - www.instaforex.com #

Forecast for GBP/USD on April 29, 2024

The premium article will be available in00:00:00

29.04.2024 06:00 AM


GBP/USD On Friday, the British pound showed a trading range of more than 90 pips, piercing the resistance level at 1.2525 (38.2% Fibonacci) with the upper shadow of the daily candle, but ultimately closing the day down by 20 pips.This morning, the price is approaching the intermediate resistance, but it has a low chance of surpassing 1.2525 because the Marlin oscillator is suggesting that it may reverse from the border of the uptrend territory. Our main scenario is bearish with


Fresh articles are available only to premium users


Read analytics in early access, getting information first
Get

Pentru mai multe detalii, va invitam sa vizitati stirea originala.

Forecast for USD/JPY on April 29, 2024

The premium article will be available in00:00:00

29.04.2024 06:00 AM


USD/JPY The USD/JPY pair has surprised us with its relentless growth. The rise occurred on large volumes (the highest in April), but far from record volumes of the year. Most likely, the price surged as stop-loss orders for short positions located above 155.55 were triggered. The price has reached the upper boundary of the global price channel at 160.45. And it is likely for the pair to stay above this level.However, we do not see any market ideas that are


Fresh articles are available only to premium users


Read analytics in early access, getting information first
Get

Pentru mai multe detalii, va invitam sa vizitati stirea originala.

What to expect for the dollar next week?

#

analytics662e6ac964b12.jpg

America will take the lead next week in delivering news to the currency market. The market is entirely focused on news surrounding the US, so this will have the greatest impact on the dollar exchange rate, which is embedded in both EUR/USD and GBP/USD.

If Monday and Tuesday are relatively quiet in terms of news, Wednesday will be truly eventful. The ISM Manufacturing Purchasing Managers' Index (PMI) will start off the week. I want to remind you that ISM indices have a higher priority than S&P indices, so the market's reaction to them can be much stronger. The S&P indices showed weak values in April, but the ISM indices are not obligated to match them. They could very well be stronger.

analytics662e6ad58ff19.jpg

In addition to the ISM index, Wednesday will see the release of the ADP Employment Report on changes in non-farm payrolls and the JOLTS report on job openings in March. Both of these reports reflect the state of the labor market, which is very important for the Federal Reserve. And Wednesday evening will mark the conclusion of the FOMC meeting. The market is not expecting a rate cut in the May meeting, although not long ago it anticipated the first round of monetary policy easing in March. Therefore, the most important event will be Fed Chair Jerome Powell's statement. If Powell indicates that the Fed is not considering a rate cut in the near future and inflation has stopped slowing down, demand for the US dollar may increase, which is what we need. I also want to note that Powell could hint at further policy tightening, as the Fed is not pleased with the current pace of inflation. Any hawkish comments will allow market participants to increase demand for the dollar once again.

On Friday, the market will receive another package of crucial information. The Nonfarm Payrolls report, the unemployment rate, wage growth, and the ISM Services PMI. All four reports are of immense importance for the US economy, the Fed, monetary policy, and the dollar exchange rate. The latest GDP report was frankly disappointing, so it is very important for the upcoming US reports to exceed market expectations. Without this, both instruments may struggle to return to a downward trend.

Wave analysis for EUR/USD:

Based on the conducted analysis of EUR/USD, I conclude that a bearish wave set is being formed. Waves 2 or b and 2 in 3 or c are complete, so in the near future, I expect an impulsive downward wave 3 in 3 or c to form with a significant decline in the instrument. I am considering short positions with targets near the 1.0462 mark, as the news background works in the dollar's favor. A successful attempt to break 1.0637, which is equal to 100.0% Fibonacci, will indicate that the market is ready for new short positions.

analytics662e6adeb6682.jpg

Wave analysis for GBP/USD:

The wave pattern of the GBP/USD instrument suggests a decline. I am considering selling the instrument with targets below the 1.2039 level, because I believe that wave 3 or c has started to form. A successful attempt to break 1.2472, which corresponds to 50.0% Fibonacci, indicates that the market is ready to build a descending wave.

Key principles of my analysis:

Wave structures should be simple and understandable. Complex structures are difficult to work with, and they often bring changes.

If you are not confident about the market's movement, it would be better not to enter it.

We cannot guarantee the direction of movement. Don't forget about Stop Loss orders.

Wave analysis can be combined with other types of analysis and trading strategies.

The material has been provided by InstaForex Company - www.instaforex.com #

What to expect for the euro next week?

#

analytics662e4c2345d38.jpg

Over the past two weeks, the market has been actively correcting the euro within the framework of the downward wave 3 or C. In my opinion, it is finally time to end this wave. Therefore, it is important for you to understand what the upcoming news background will bring. Will it be positive for the single currency or the opposite?

There will be quite a few interesting reports in the European Union. On Monday, one of the most important reports at the moment will be released in Germany – on inflation. The Consumer Price Index is expected to rise to 2.3% in April from 2.2% in March. An accelerated pace of inflation may support the euro, but in this case, we are about a minor pickup. At the same time, the indicator will remain in close proximity to the target level if the forecast is realized. In addition, German inflation is just inflation in one country of the European Union, albeit the most influential one. If the CPI slows down in most other countries, then overall inflation in the EU will decrease. And this is bad for the euro, because in this case the European Central Bank will have more reasons to conduct the first round of easing in June.

analytics662e4c2bd271a.jpg

The euro area inflation report will be released on Tuesday. The CPI is expected to remain unchanged at 2.4% in April. Also, the preliminary estimate of GDP for the first quarter will be released. The bloc economy may grow by 0.1%. Such a value is unlikely to have a positive impact on buyers, as this growth is practically equivalent to no growth at all. And this has been the case in the EU for several quarters now. Regarding European inflation, the lack of changes means no changes in the sentiment of the ECB policymakers. The baseline scenario for interest rates will remain the same.

In addition, reports on the Manufacturing PMI and the unemployment rate will be released. These data no longer have the same degree of influence on market sentiment as before. Based on all the above, if inflation in Germany and the EU does not suddenly accelerate, demand for the euro may start to fall again. This is the scenario I am counting on.

Wave analysis for EUR/USD:

Based on the conducted analysis of EUR/USD, I conclude that a bearish wave set is being formed. Waves 2 or b and 2 in 3 or c are complete, so in the near future, I expect an impulsive downward wave 3 in 3 or c to form with a significant decline in the instrument. I am considering short positions with targets near the 1.0462 mark, as the news background works in the dollar's favor. A successful attempt to break 1.0637, which is equal to 100.0% Fibonacci, will indicate that the market is ready for new short positions.

analytics662e4c341a7ed.jpg

Wave analysis for GBP/USD:

The wave pattern of the GBP/USD instrument suggests a decline. I am considering selling the instrument with targets below the 1.2039 level, because I believe that wave 3 or c has started to form. A successful attempt to break 1.2472, which corresponds to 50.0% Fibonacci, indicates that the market is ready to build a descending wave.

Key principles of my analysis:

Wave structures should be simple and understandable. Complex structures are difficult to work with, and they often bring changes.

If you are not confident about the market's movement, it would be better not to enter it.

We cannot guarantee the direction of movement. Don't forget about Stop Loss orders.

Wave analysis can be combined with other types of analysis and trading strategies.

The material has been provided by InstaForex Company - www.instaforex.com #